
Reason to trust
How Our News is Made
Strict editorial policy that focuses on accuracy, relevance, and impartiality
Ad discliamer
Morbi pretium leo et nisl aliquam mollis. Quisque arcu lorem, ultricies quis pellentesque nec, ullamcorper eu odio.
Bitcoin price attempted a recovery above $56,000 against the US Dollar, but it struggled above $57,000. BTC trimmed gains and it even broke the $53,200 support zone.
- Bitcoin extended its decline below $53,200 and $53,000 support levels.
- The price is now trading well below $54,000 and the 100 hourly simple moving average.
- There was a break below a key bullish trend line with support near $54,220 on the hourly chart of the BTC/USD pair (data feed from Kraken).
- The pair is likely to continue lower towards the $51,000 and $50,000 levels in the near term.
Bitcoin Price Extends Losses
Yesterday, bitcoin started a decent recovery above the $55,500 and $56,000 levels. BTC even spiked above the $57,000 resistance and the 100 hourly simple moving average.
However, the price struggled to continue higher and it started a fresh decline from the $57,235 high. It broke a few important supports near the $56,000 and $55,500 levels. There was also a break below a key bullish trend line with support near $54,220 on the hourly chart of the BTC/USD pair.
The price even declined below the $54,000 support level and the $53,200 pivot level. It traded to a new weekly low at $51,634 and it is now consolidating losses. An initial resistance is near the $53,000 level. It is close to the 23.6% Fib retracement level of the recent decline from the $57,235 high to $51,634 low.
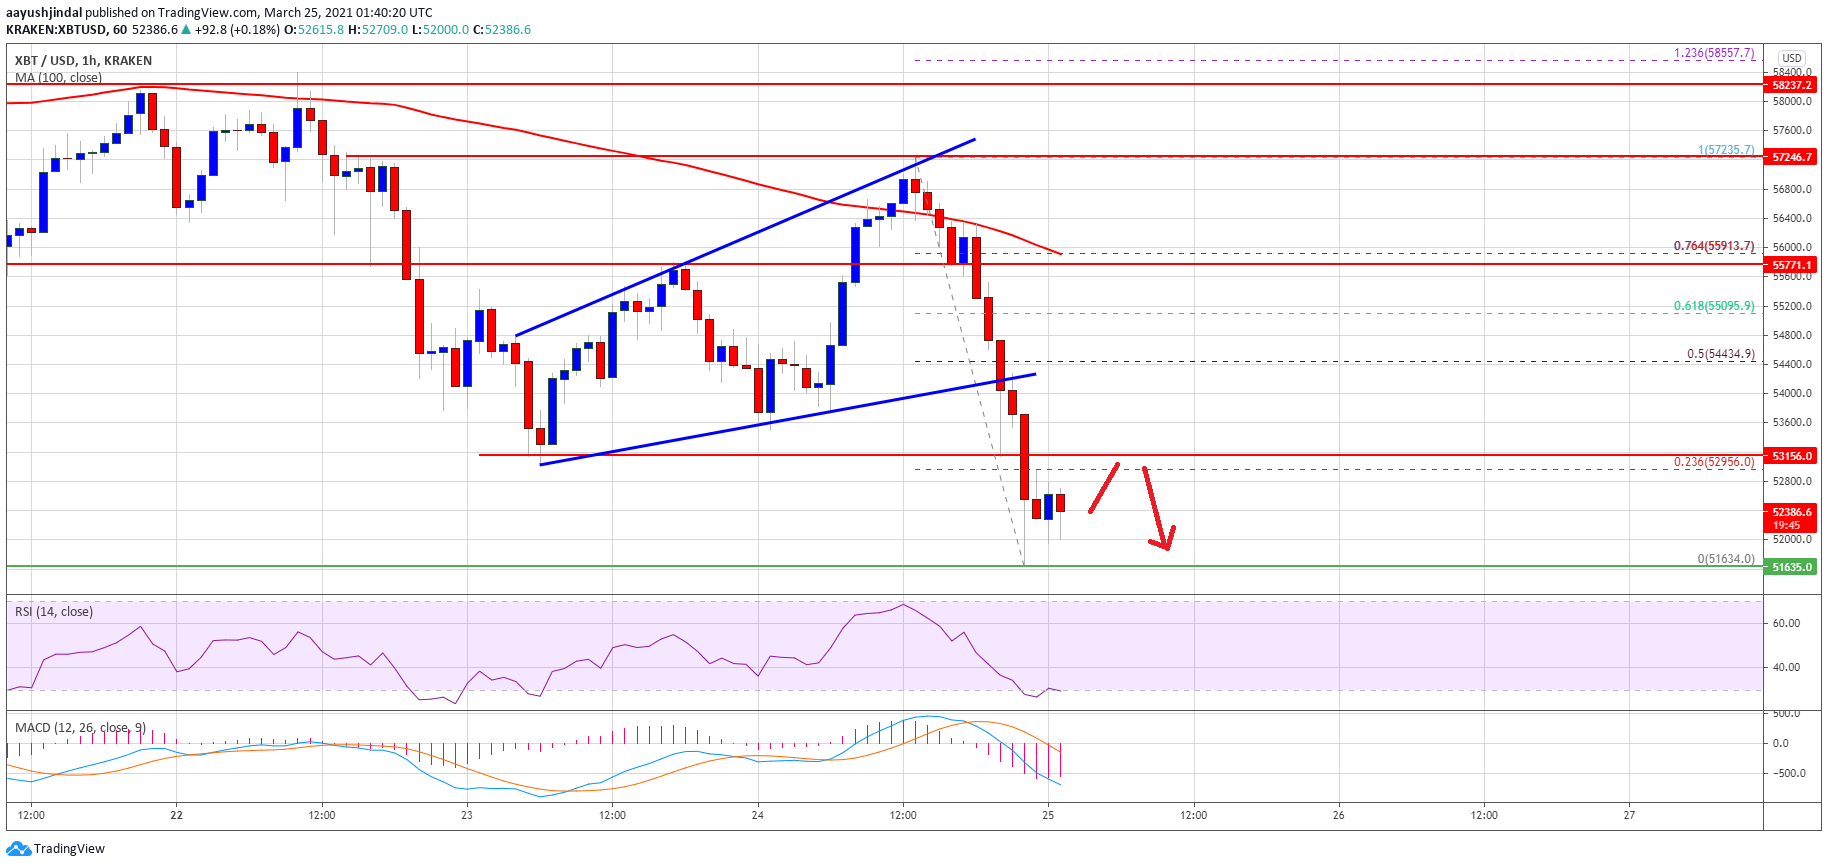
Source: BTCUSD on TradingView.com
The first major resistance is near the $53,200 pivot level. If there is a fresh increase above $53,200, the price could recover towards the $54,500 level. The 50% Fib retracement level of the recent decline from the $57,235 high to $51,634 low is also close to $54,500.
More Losses in BTC?
If bitcoin fails to correct higher above $53,200 and $54,500, there are chances of more downsides in the near term. An initial support is near the $51,500 level.
The first key support is now near the $51,000 level, below which the price is likely to test the $50,000 support zone. Any more losses might call for a move towards the $48,000 level.
Technical indicators:
Hourly MACD – The MACD is now gaining momentum in the bearish zone.
Hourly RSI (Relative Strength Index) – The RSI for BTC/USD is now well below the 40 level.
Major Support Levels – $51,000, followed by $50,000.
Major Resistance Levels – $53,200, $54,500 and $55,000.