
Reason to trust
How Our News is Made
Strict editorial policy that focuses on accuracy, relevance, and impartiality
Ad discliamer
Morbi pretium leo et nisl aliquam mollis. Quisque arcu lorem, ultricies quis pellentesque nec, ullamcorper eu odio.
Bitcoin price is up over 5% and it is trading above the $19,500 level against the US Dollar. BTC bulls seem to be aiming a new all-time high above the $20,000 resistance.
- Bitcoin is rising steadily and it broke a major hurdle at $19,500.
- The price traded as high as $19,860 and it is now well above the 100 hourly simple moving average.
- There is a key contracting triangle forming with resistance near $19,800 on the hourly chart of the BTC/USD pair (data feed from Kraken).
- The pair could start a strong surge once it clears the $19,800 and $19,850 levels.
Bitcoin Price is Approaching $20K
Yesterday, we saw the start of a decent increase in bitcoin price above the $18,500 resistance. BTC remained in a positive zone and cleared the $19,000 resistance.
The price even climbed above the $19,500 resistance and traded to a new 2020. Bitcoin price traded as high as $19,860 and it is now well above the 100 hourly simple moving average. There was a minor downside correction recently below the 23.6% Fib retracement level of the recent wave from the $18,335 swing low to $19,860 high.
There was a spike below the $19,200 level, but dips were limited. The 50% Fib retracement level of the recent wave from the $18,335 swing low to $19,860 high acted as a strong support.
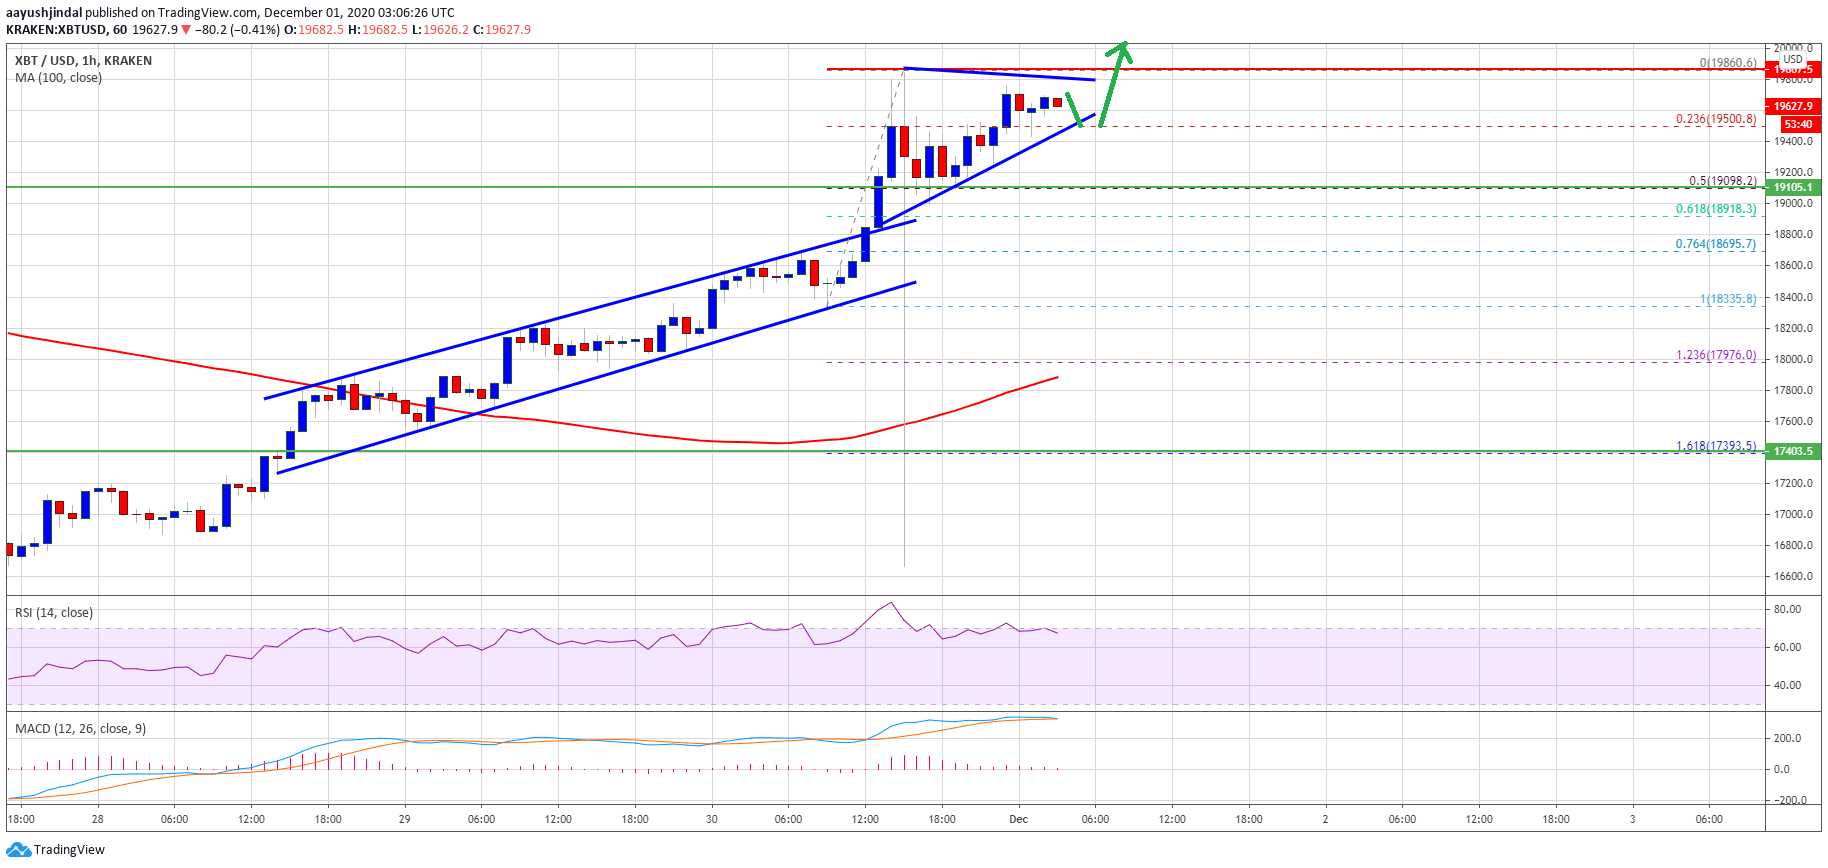
Source: BTCUSD on TradingView.com
Bitcoin formed a support base near $19,200 and it is currently trading above $19,500. There is also a key contracting triangle forming with resistance near $19,800 on the hourly chart of the BTC/USD pair.
If there is a clear break above the triangle resistance and $19,860, the price could start a strong surge in the coming sessions. In the stated case, the bulls might aim a new all-time high above the $20,000 level.
Downside Correction in BTC?
If bitcoin fails to clear the triangle resistance at $19,800, there could be a short-term downside correction. An initial support on the downside is near the triangle lower trend line at $19,550.
A clear break below the triangle support might start an extended decline towards $19,200. The next major support below the $19,200 level is near the $18,800 level (a multi-touch zone).
Technical indicators:
Hourly MACD – The MACD is slowly losing momentum in the bullish zone.
Hourly RSI (Relative Strength Index) – The RSI for BTC/USD is currently correcting lower from the 70 level.
Major Support Levels – $19,550, followed by $19,200.
Major Resistance Levels – $19,800, $19,860 and $20,000.


