
Reason to trust
How Our News is Made
Strict editorial policy that focuses on accuracy, relevance, and impartiality
Ad discliamer
Morbi pretium leo et nisl aliquam mollis. Quisque arcu lorem, ultricies quis pellentesque nec, ullamcorper eu odio.
Bitcoin price started a fresh increase after a drop towards $53,000 against the US Dollar. BTC is now forming an inverse head and shoulders, with chances of a break above $58,000.
- Bitcoin is showing positive signs above the $55,000 support zone.
- The price is now facing resistance near $58,000 and the 100 hourly simple moving average.
- There is a key bearish trend line forming with resistance near $58,000 on the hourly chart of the BTC/USD pair (data feed from Kraken).
- The pair is likely setting up for an upside break above the $58,000 resistance.
Bitcoin Price is Recovering
After a sharp decline, bitcoin found support above the $53,000 level. BTC traded as low as $53,222 and recently started a fresh increase. It cleared the $54,200 and $55,000 resistance levels.
There was a recovery above the 23.6% Fib retracement level of the downward move from the $61,695 high to $53,220 low. The price even climbed above the $56,000 level. However, the price is facing resistance near $58,000 and the 100 hourly simple moving average.
It seems like there is a possible inverse head and shoulders pattern forming with resistance near the $57,000 level. There is also a key bearish trend line forming with resistance near $58,000 on the hourly chart of the BTC/USD pair.
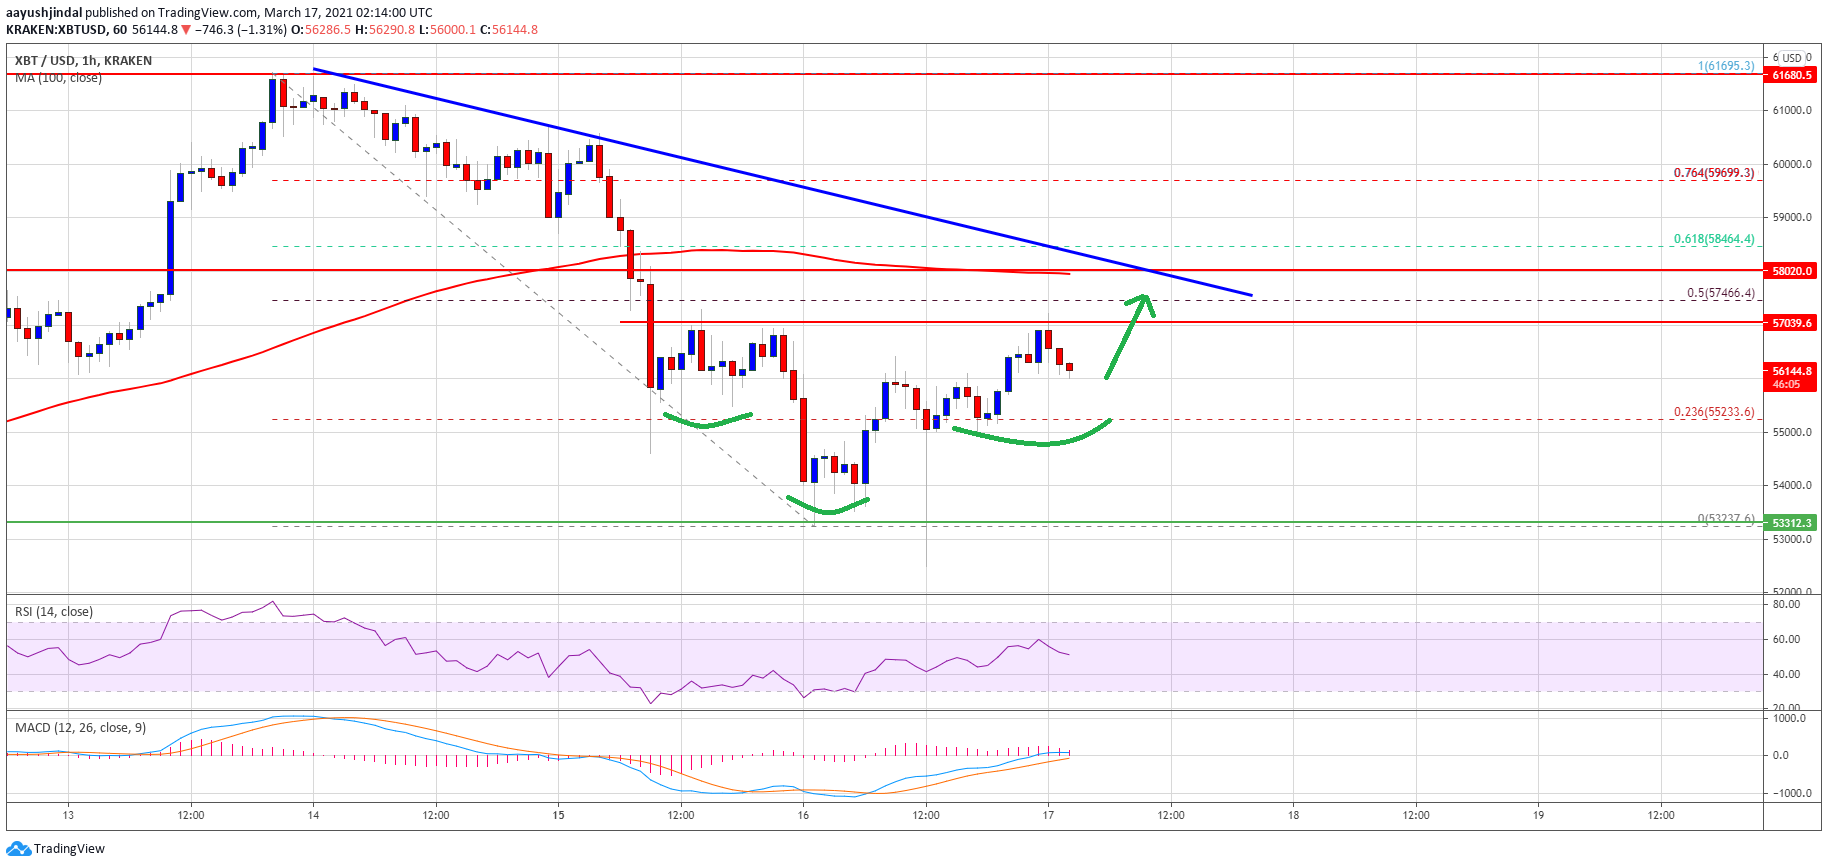
Source: BTCUSD on TradingView.com
The trend line is close to the 50% Fib retracement level of the downward move from the $61,695 high to $53,220 low. A successful break above the trend line resistance could open the doors for a decent increase towards the $58,800 and $60,000 levels.
Fresh Dip in BTC?
If bitcoin fails to correct higher above the $57,000 and $58,000 resistance levels, it could start a fresh decline. The first key support on the downside is near the $55,000 level.
The next key support is near the $54,200 level. If there is a clear break below the $54,200 level, the price is likely to continue lower in the coming sessions. The next major support is near $53,200, below which the bears might aim a test of the $50,000 support level.
Technical indicators:
Hourly MACD – The MACD is slowly gaining momentum in the bullish zone.
Hourly RSI (Relative Strength Index) – The RSI for BTC/USD is struggling to stay above the 50 level.
Major Support Levels – $55,000, followed by $54,200.
Major Resistance Levels – $57,000, $57,500 and $58,000.


