
Reason to trust
How Our News is Made
Strict editorial policy that focuses on accuracy, relevance, and impartiality
Ad discliamer
Morbi pretium leo et nisl aliquam mollis. Quisque arcu lorem, ultricies quis pellentesque nec, ullamcorper eu odio.
Bitcoin price is trading in a positive zone above the $19,000 zone against the US Dollar. BTC broke a key bullish pattern, suggesting high chances of more upsides above $19,500.
- Bitcoin is trading in a positive zone above the $18,800 and $19,000 resistance levels.
- The price is now trading well above the $19,000 level and the 100 hourly simple moving average.
- There was a break above a key contracting triangle with resistance near $19,150 on the hourly chart of the BTC/USD pair (data feed from Kraken).
- The pair is likely to continue higher above key $19,500 resistance level in the near term.
Bitcoin Price is Showing Bullish Signs
After forming a strong support base near $17,600, bitcoin price started a steady increase. BTC surpassed many key hurdles near the $18,000 and $18,500 levels to move into a bullish zone.
The recent upward move was such that the price climbed above the $19,000 resistance and the 100 hourly simple moving average. Moreover, there was a break above a key contracting triangle with resistance near $19,150 on the hourly chart of the BTC/USD pair.
Bitcoin price is now trading above the 50% Fib retracement level of the recent downside correction from the $19,433 high to $18,959 low. It is showing a lot of positive signs above the $19,150 and $19,200 levels.
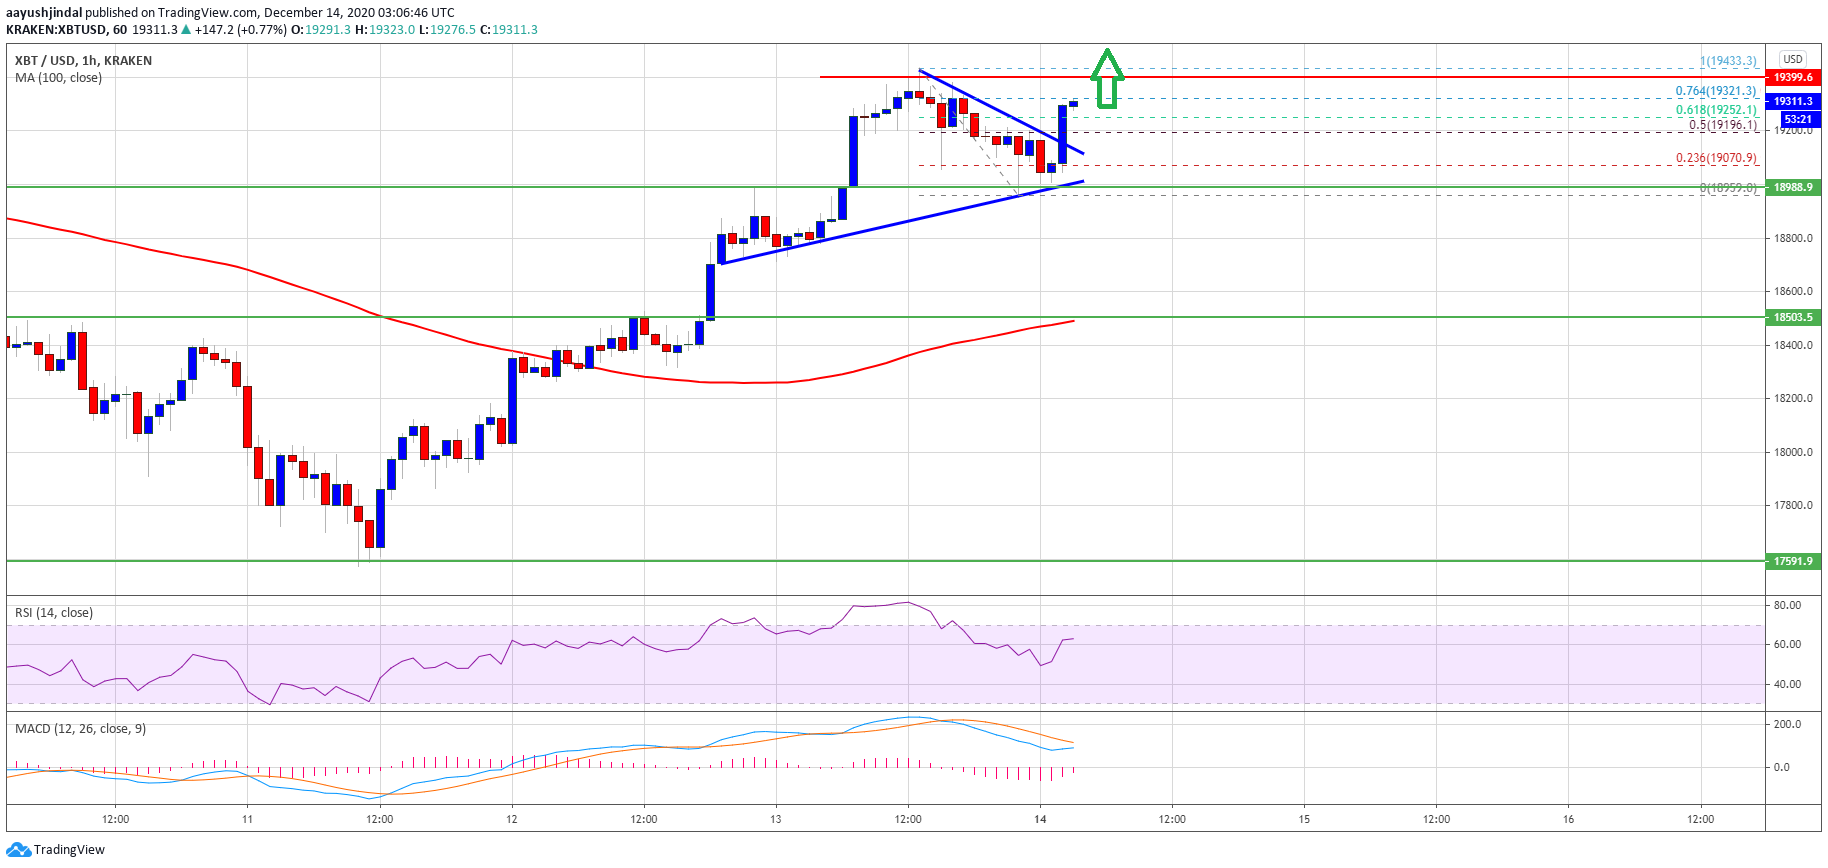
Source: BTCUSD on TradingView.com
An immediate resistance is near the $19,320 level or the 76.4% Fib retracement level of the recent downside correction from the $19,433 high to $18,959 low. A break above $19,320 could open the doors for more upsides above the $19,433 high.
In the stated case, there are high chances of a strong upward move above the $19,500 resistance. The next major resistance is near the $19,800 level, followed by $20K.
Downsides Supported in BTC?
If bitcoin starts a short-term downside correction, it could find support near the $19,200 level or the broken triangle trend line. The first key support is near the $19,150 level.
The main support is now forming near the $19,000 level. A proper daily close below the $19,000 level could lead the price towards the $18,500 support level in the near term.
Technical indicators:
Hourly MACD – The MACD is slowly gaining pace in the bullish zone.
Hourly RSI (Relative Strength Index) – The RSI for BTC/USD is currently well above the 50 level.
Major Support Levels – $19,150, followed by $19,000.
Major Resistance Levels – $19,320, $19,500 and $19,800.