
Reason to trust
How Our News is Made
Strict editorial policy that focuses on accuracy, relevance, and impartiality
Ad discliamer
Morbi pretium leo et nisl aliquam mollis. Quisque arcu lorem, ultricies quis pellentesque nec, ullamcorper eu odio.
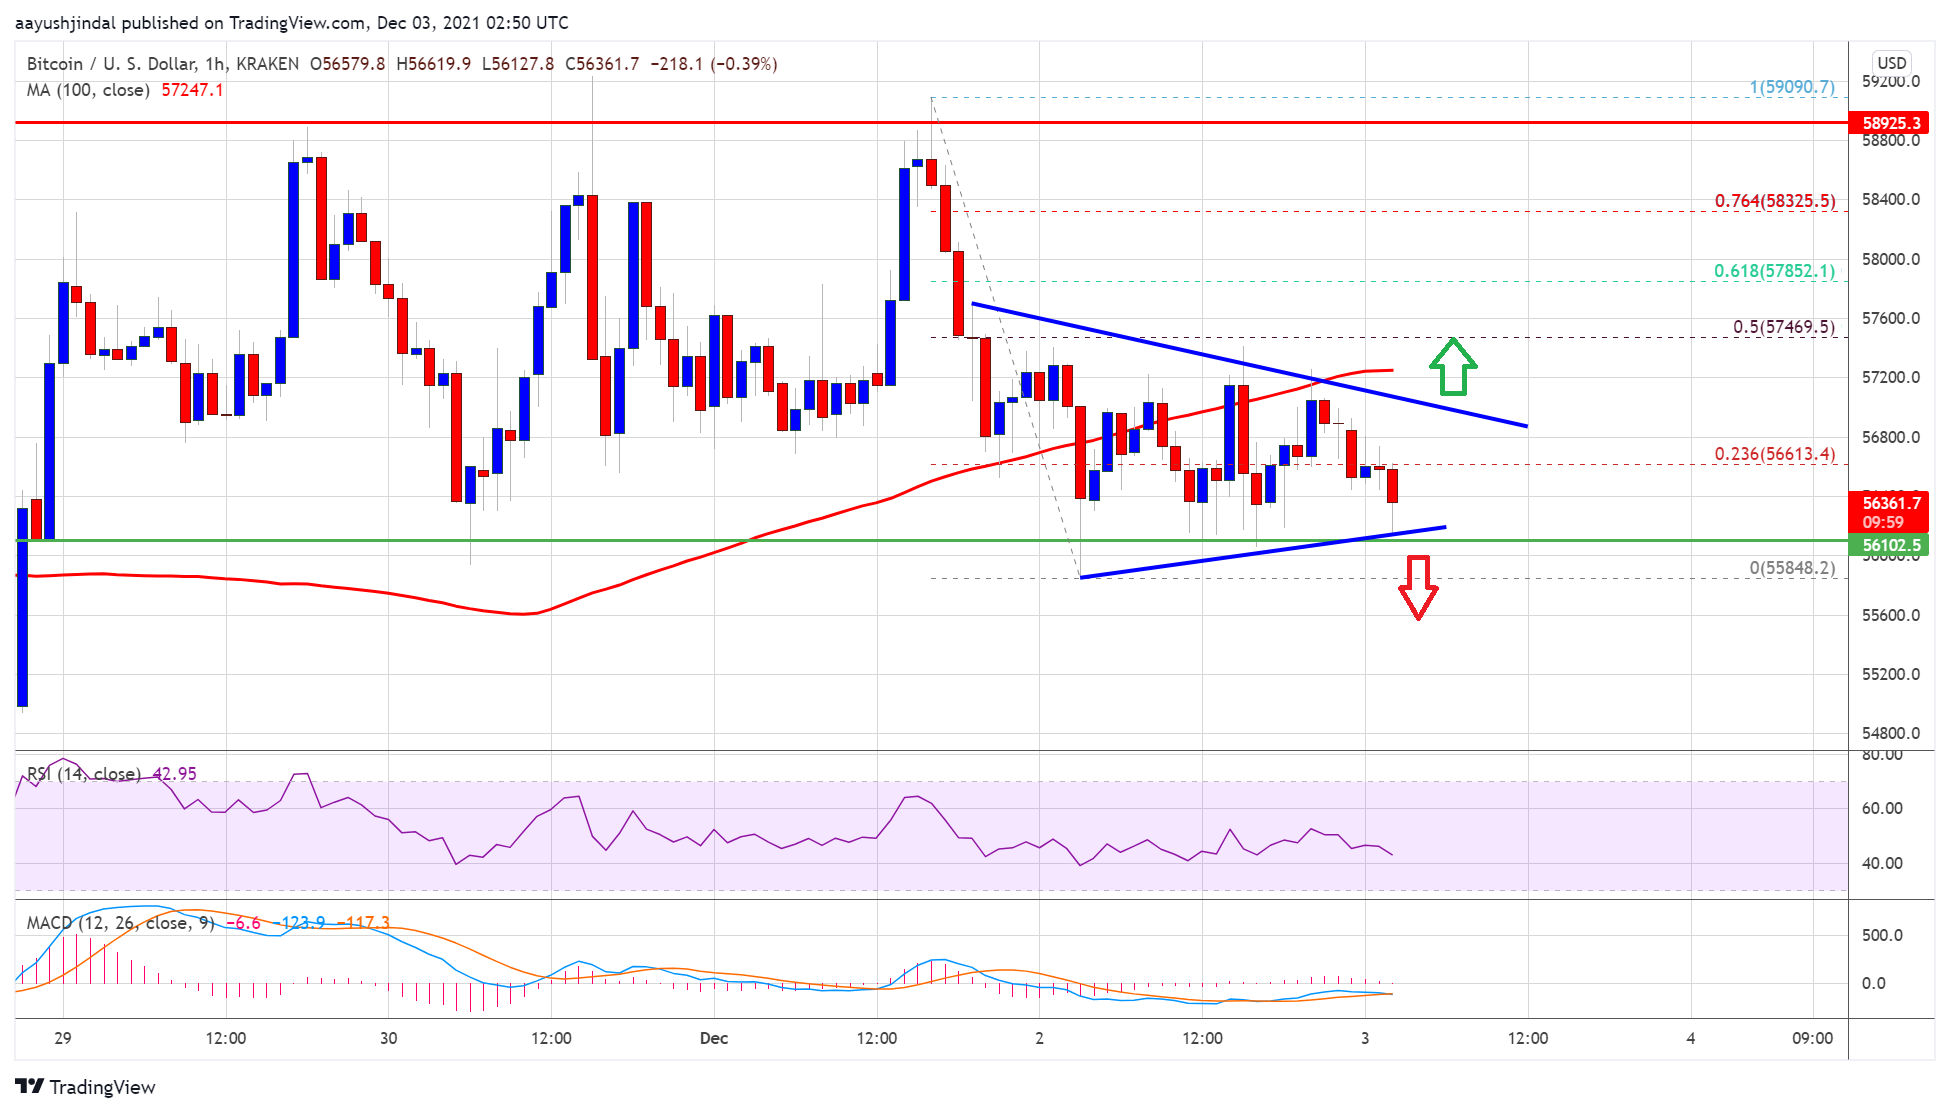
Bitcoin is struggling to surpass the $57,200 resistance against the US Dollar. BTC is declining and it might accelerate lower if there is a close below the $56,000 support.
- Bitcoin is struggling to move above the $57,000 and $57,500 levels.
- The price is now trading below $57,000 and the 100 hourly simple moving average.
- There is a key contracting triangle forming with support near $56,100 on the hourly chart of the BTC/USD pair (data feed from Kraken).
- The pair could accelerate lower if there is a clear break below the $56,000 support zone.
Bitcoin Price is Facing Hurdles
Bitcoin price failed to start a decent increase above the $58,000 resistance zone. BTC started a slow decline, and it broke the $57,200 support level to enter a bearish zone.
There was also a close below $57,000 and the 100 hourly simple moving average. However, the bulls are defending the $56,000 support level. The recent low was formed near $55,848 and bitcoin is now consolidating losses above the $56,000 level.
An immediate resistance on the upside is near the $56,600 level. It is near the 23.6% Fib retracement level of the recent decline from the $59,090 swing high to $55,848 low.
The first major resistance is near the $57,000 level. There is also a key contracting triangle forming with support near $56,100 on the hourly chart of the BTC/USD pair. The next major resistance is near $57,500. It is close to the 50% Fib retracement level of the recent decline from the $59,090 swing high to $55,848 low.
A clear break above the $57,500 resistance zone could open the doors for more upsides. The next key resistance is near the $58,500 level, above which the price could rise steadily. The next stop for the bulls may possibly be near the $60,000 level.
More Losses In BTC?
If bitcoin fails to clear the $57,500 resistance zone, it could extend losses. An immediate support on the downside is near the $56,100 level.
The first major support is now forming near the $56,000 level. A downside break below the $56,000 support may perhaps start a sharp decline. The next stop for the bears might be $53,500.
Technical indicators:
Hourly MACD – The MACD is now gaining pace in the bearish zone.
Hourly RSI (Relative Strength Index) – The RSI for BTC/USD is currently below the 50 level.
Major Support Levels – $56,000, followed by $55,000.
Major Resistance Levels – $57,000, $58,500 and $58,500.


