Reason to trust
How Our News is Made
Strict editorial policy that focuses on accuracy, relevance, and impartiality
Ad discliamer
Morbi pretium leo et nisl aliquam mollis. Quisque arcu lorem, ultricies quis pellentesque nec, ullamcorper eu odio.
Bitcoin price started a downside correction from the $52,750 all-time high against the US Dollar. BTC is now approaching a couple of important supports near $50,500.
- Bitcoin topped near the $52,750 level and started a downside correction.
- The price is still well above $50,000 and the 100 hourly simple moving average.
- There is a major bullish trend line forming with support near $50,400 on the hourly chart of the BTC/USD pair (data feed from Kraken).
- The pair is likely to bounce back from $50,400 or $50,000 in the coming sessions.
Bitcoin Price is Correcting Gains
After setting a new all-time high near $52,750, bitcoin price started a downside correction. BTC broke the $52,000 support level to move into a short-term bearish zone.
There was a break below the 23.6% Fib retracement level of the upward move from the $47,843 swing low to $52,750 high. It is now approaching a couple of important supports near the $50,500 level.
More importantly, bitcoin is still well above $50,000 and the 100 hourly simple moving average. There is also a major bullish trend line forming with support near $50,400 on the hourly chart of the BTC/USD pair. The next major support is near the $50,320 level.
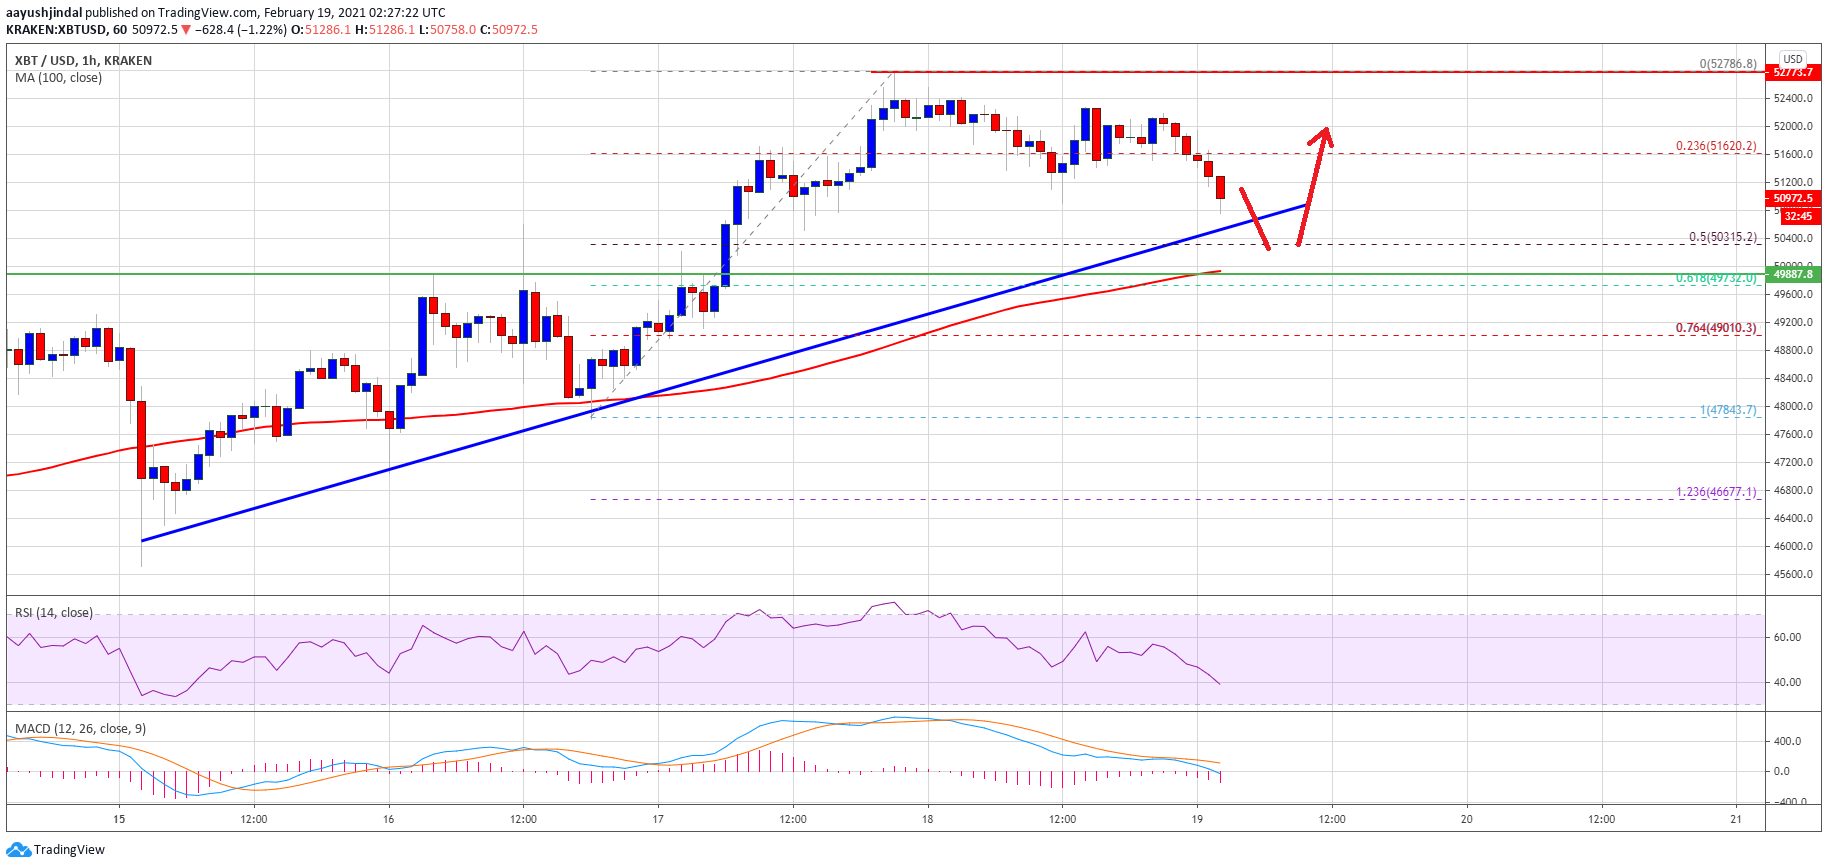
Source: BTCUSD on TradingView.com
The 50% Fib retracement level of the upward move from the $47,843 swing low to $52,750 high is near the $50,320 level to provide support. The main support is forming near $50,000 and the 100 hourly simple moving average. Any more losses may possibly start a steady decline towards the $48,000 support zone. Any more losses might call for a test of the key $45,000 support level.
Fresh Increase in BTC?
If bitcoin remains stable above the $50,500 and $50,000 support levels, it could start a fresh increase. An initial resistance on the upside is near the $51,500 level.
The first major resistance is near the $52,000 level, above which the price is likely to accelerate higher towards the $52,750 high. If the price gains pace above $52,500 and $52,750, there are high chances of an upside break above the $53,500 level in the coming sessions.
Technical indicators:
Hourly MACD – The MACD is slowly gaining momentum in the bearish zone.
Hourly RSI (Relative Strength Index) – The RSI for BTC/USD is now well below the 50 level.
Major Support Levels – $50,500, followed by $50,000.
Major Resistance Levels – $51,500, $52,000 and $52,750.