
Reason to trust
How Our News is Made
Strict editorial policy that focuses on accuracy, relevance, and impartiality
Ad discliamer
Morbi pretium leo et nisl aliquam mollis. Quisque arcu lorem, ultricies quis pellentesque nec, ullamcorper eu odio.
Bitcoin price started a downside correction below the $23,000 support against the US Dollar. BTC is likely to decline again as long as it is below $23,500 and the 100 hourly SMA.
- Bitcoin started a fresh correction and traded below the $23,500 and 23,200 support levels.
- The price is currently trading well below $23,500 and the 100 hourly simple moving average.
- There was a break below a major bullish trend line with support near $23,250 on the hourly chart of the BTC/USD pair (data feed from Kraken).
- The pair is likely to continue lower unless it clears $23,500 and the 100 hourly SMA.
Bitcoin Price is Correcting Gains
After yet another failure near $24,000, bitcoin price started a downside correction. BTC traded below the $23,500 and 23,200 support levels to move into a short-term bearish zone.
The price even declined below $22,500 and settled below the 100 hourly simple moving average. There was also a break below a major bullish trend line with support near $23,250 on the hourly chart of the BTC/USD pair. A low was formed near $21,879 before the price started a strong recovery.
Bitcoin climbed above the $22,000 and $22,200 levels. It even spiked above the 50% Fib retracement level of the recent decline from the $24,300 swing high to $21,879 low.
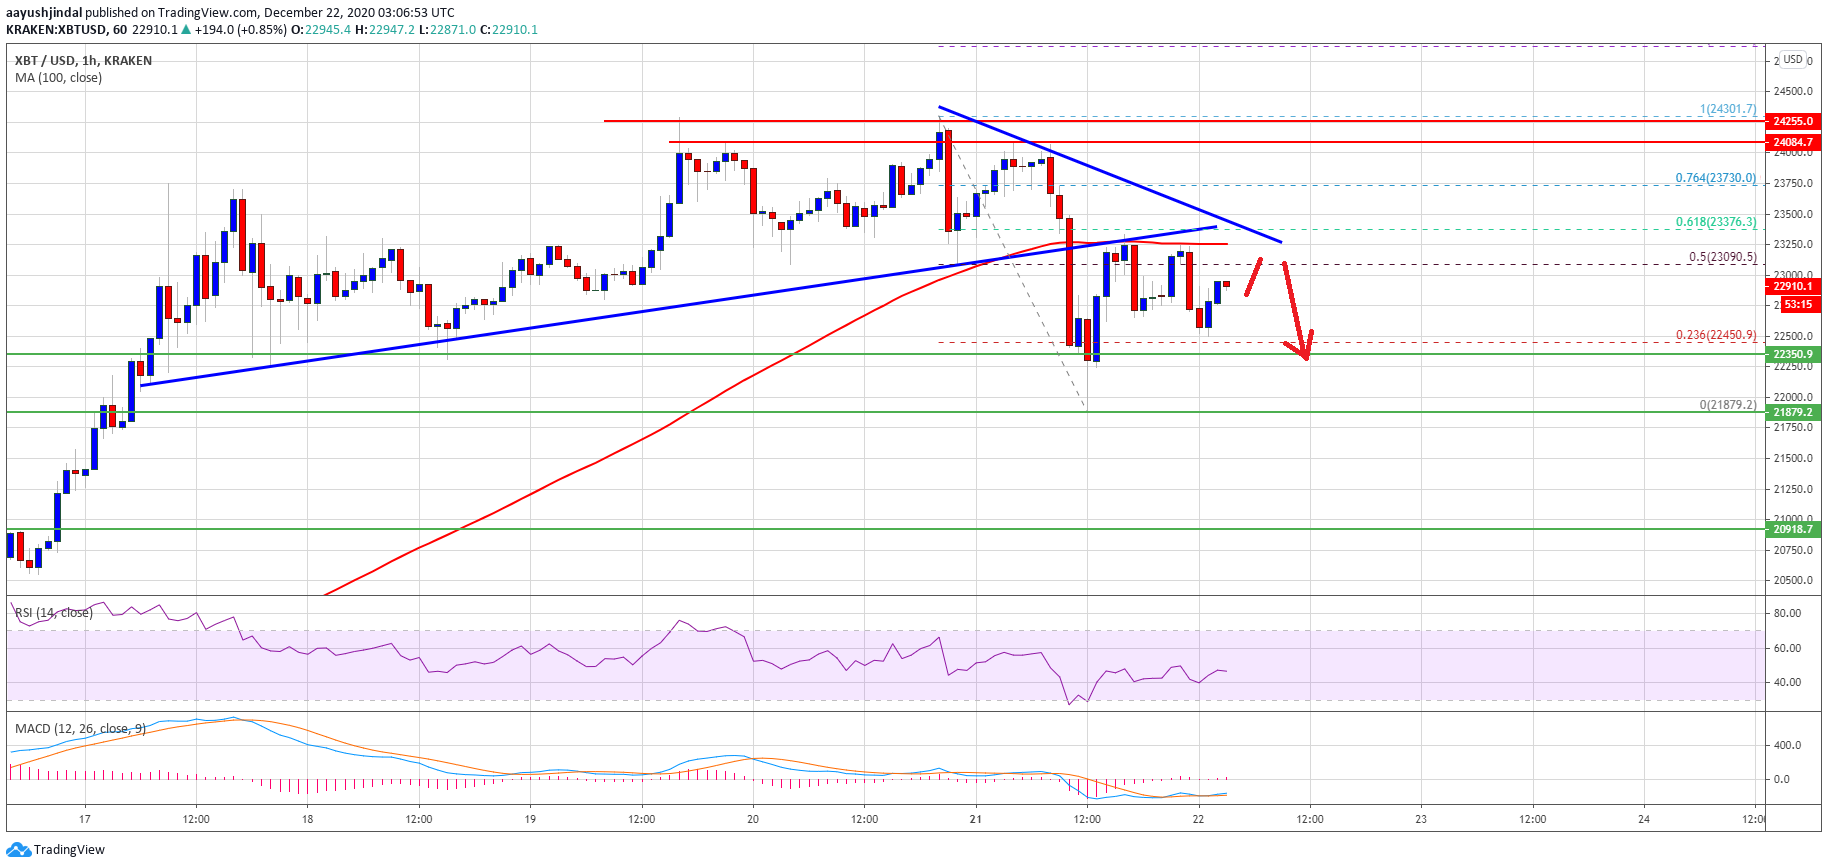
Source: BTCUSD on TradingView.com
However, the bulls struggled to surpass the $23,200 resistance level and the broken trend line. The 100 hourly simple moving average is also acting as a strong resistance near $23,400. More importantly, there is a connecting bearish trend line forming with resistance near $23,400.
The trend line is close to the 61.8% Fib retracement level of the recent decline from the $24,300 swing high to $21,879 low. A close above the trend line resistance, 100 hourly SMA, and $23,500 could open the doors for a fresh surge towards $24,000 and $24,300.
More Downsides in BTC?
If bitcoin fails to surpass the 100 hourly SMA and $23,500, it could start another decline. An initial support on the downside is near the $22,500 level.
The first key support is near the $22,200 level. The main support is forming near the $22,000 level, below which there is a risk of a drop towards the $21,000 zone in the near term.
Technical indicators:
Hourly MACD – The MACD is struggling to move into the bullish zone.
Hourly RSI (Relative Strength Index) – The RSI for BTC/USD is currently just below the 50 level.
Major Support Levels – $22,200, followed by $22,000.
Major Resistance Levels – $23,000, $23,200 and $23,500.


