
Reason to trust
How Our News is Made
Strict editorial policy that focuses on accuracy, relevance, and impartiality
Ad discliamer
Morbi pretium leo et nisl aliquam mollis. Quisque arcu lorem, ultricies quis pellentesque nec, ullamcorper eu odio.
Bitcoin price is stuck in a broad range below the $11,000 resistance against the US Dollar. BTC is likely to decline sharply if it continues to fail near $10,800 and $11,000.
- Bitcoin is struggling to gain bullish momentum and it is well below the $11,000 resistance.
- The price is approaching the 100 hourly simple moving average and the $10,750 support.
- There is a major contracting triangle forming with resistance near $10,850 on the hourly chart of the BTC/USD pair (data feed from Kraken).
- The pair could either surge above $10,850 or it might start a fresh decline towards $10,200.
Bitcoin Price is Stuck in a Range
After a sharp bearish reaction from the $10,950 zone, bitcoin price found support near the $10,650 level against the US Dollar. The bears made a couple of attempts to clear the $10,650 support, but they failed.
The recent low was formed near $10,647 before the price recovered above $10,750. The price traded as high as $10,860 and it is currently correcting lower. There was a break below the 23.6% Fib retracement level of the recent rise from the $10,647 low to $10,860 high.
Bitcoin is now approaching the 100 hourly simple moving average and the $10,750 support. It is close to the 50% Fib retracement level of the recent rise from the $10,647 low to $10,860 high.
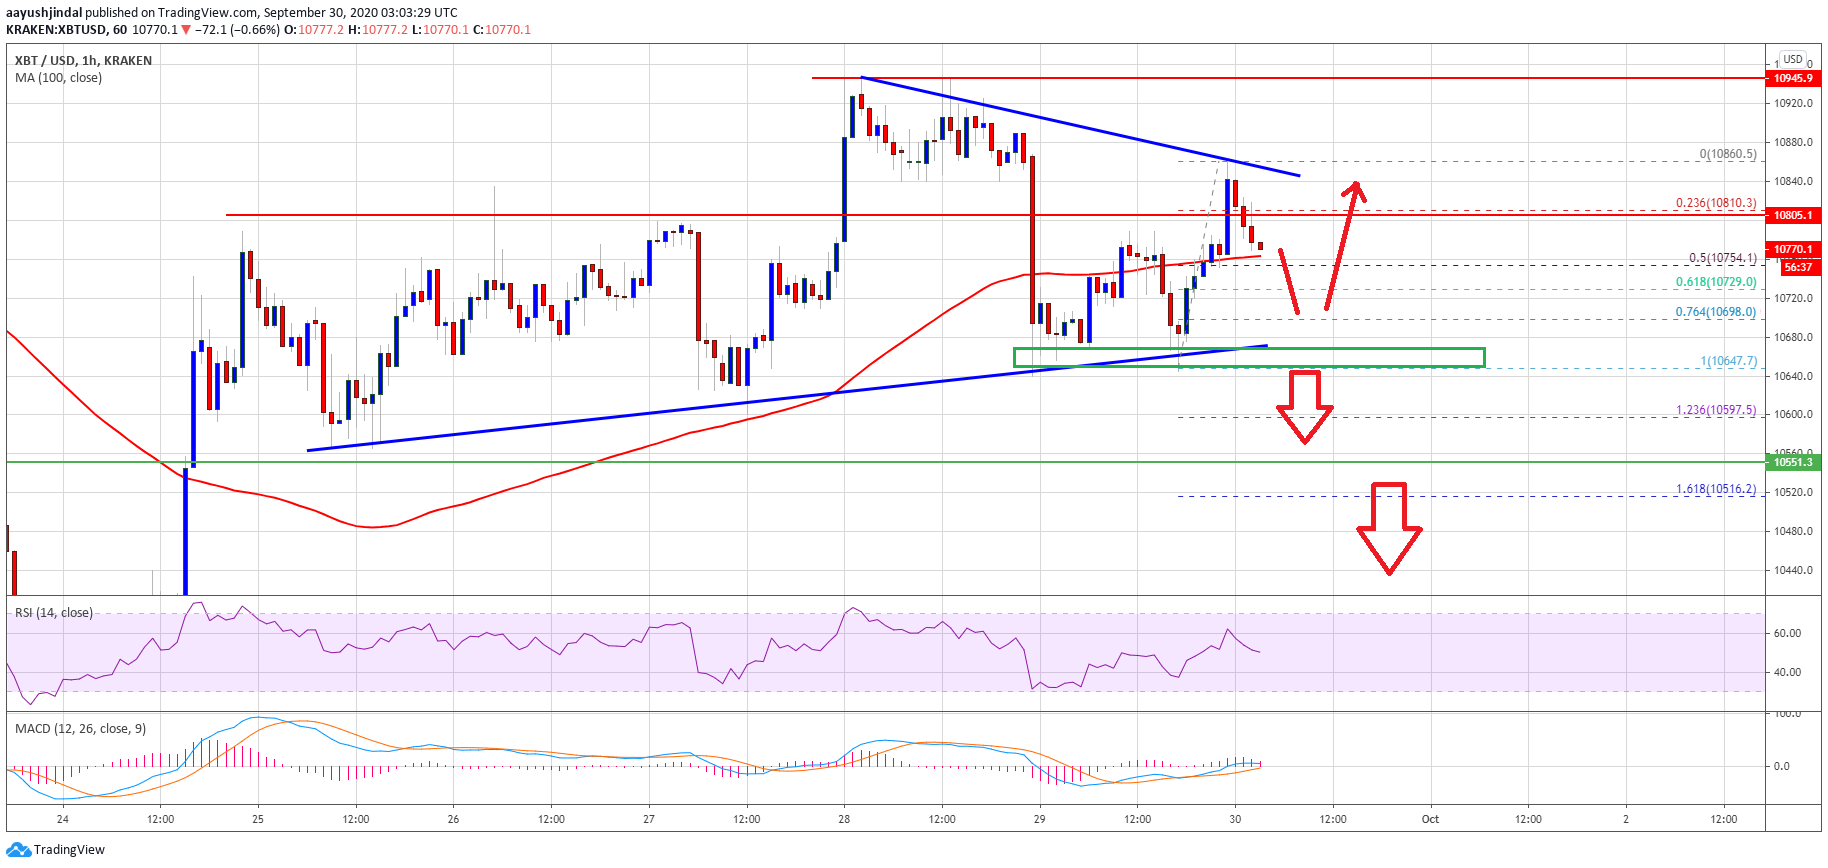
Bitcoin price trades below $10,800. Source: TradingView.com
It seems like there is a major contracting triangle forming with resistance near $10,850 on the hourly chart of the BTC/USD pair. To start a strong increase, the price must clear the triangle resistance and then the $10,950 zone.
The main hurdle is still near the $11,000 resistance, above which there are real chances of a sustained upward move towards the $11,500 and $11,600 levels in the near term.
Downsides Break in BTC?
If bitcoin fails to climb above the $10,800 and $10,850 resistance levels, there is a risk of a downside break. The first key support is near the triangle lower trend line or $10,650.
A clear break below the $10,650 support might increase chances of more downsides below the main support zone at $10,550. In the stated case, the price is likely to dive towards $10,200 or even $10,000 in the coming sessions.
Technical indicators:
Hourly MACD – The MACD is struggling to gain pace in the bullish zone.
Hourly RSI (Relative Strength Index) – The RSI for BTC/USD is currently testing the 50 level.
Major Support Levels – $10,650, followed by $10,550.
Major Resistance Levels – $10,850, $10,950 and $11,000.


