
Reason to trust
How Our News is Made
Strict editorial policy that focuses on accuracy, relevance, and impartiality
Ad discliamer
Morbi pretium leo et nisl aliquam mollis. Quisque arcu lorem, ultricies quis pellentesque nec, ullamcorper eu odio.
- Bitcoin price declined recently and traded below the $3,725 support against the US Dollar.
- There is a short term breakout pattern forming with resistance near $3,650 on the 4-hours chart of the BTC/USD pair (data feed from Kraken).
- The pair may soon make the next move either above $3,650 or below $3,550 in the near term.
Bitcoin price faced an increased selling pressure below $3,700 against the US Dollar. BTC/USD is aligned for the next break either bullish above $3,650 or bearish below $3,550.
Bitcoin Price Analysis
This past week, bitcoin price started a major downward move from the $4,037 swing high against the US Dollar. The BTC/USD pair declined heavily and broke the $4,000, $3,800, $3,725 and $3,650 support levels. The decline was nasty as there was a close below the $3,725 level and the 100 simple moving average (4-hours). It traded close to the $3,550 support area and later started consolidating losses. An initial resistance on the upside is near the $3,650 and $3,660 levels.
More importantly, there is a short term breakout pattern forming with resistance near $3,650 on the 4-hours chart of the BTC/USD pair. Therefore, the pair seems to be preparing the next break either above $3,650 or below $3,550 in the near term. A break above the $3,650 level may push the price towards the $3,660. It represents the 23.6% Fib retracement level of the last drop from the $4,037 high to $3,549 low. A successful close above the $3,660 and $3,665 level may open the doors for a bullish recovery towards $3,725. The main resistance is near the $3,790 level. It coincides with the 50% Fib retracement level of the last drop from the $4,037 high to $3,549 low.
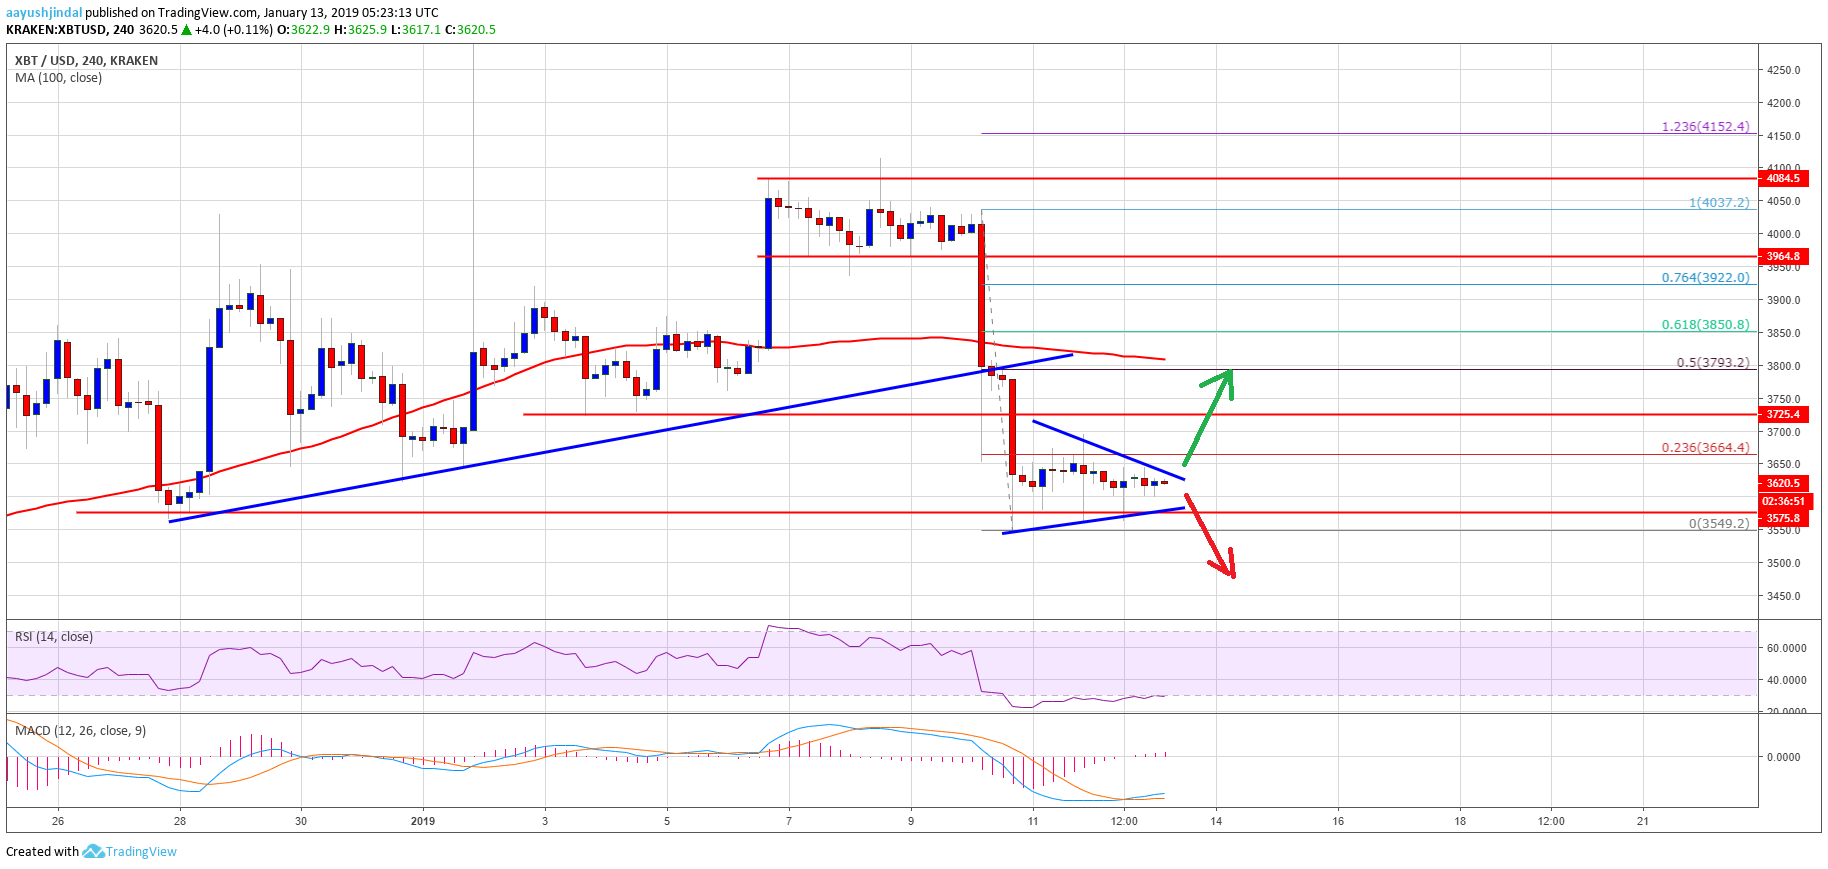
Looking at the chart, BTC price could even break the $3,550 support and extend losses. In the stated bearish scenario, the price may extend losses below $3,500 and $3,400.
Technical indicators
4-hours MACD – The MACD for BTC/USD is slowly moving in the bullish zone, with lack of strength.
4-hours RSI (Relative Strength Index) – The RSI for BTC/USD is currently near the 30 level, with a bullish angle.
Major Support Level – $3,550
Major Resistance Level – $3,660