Key Points
- Bitcoin price made a sharp downside move and traded below the $12,000 support against the US Dollar.
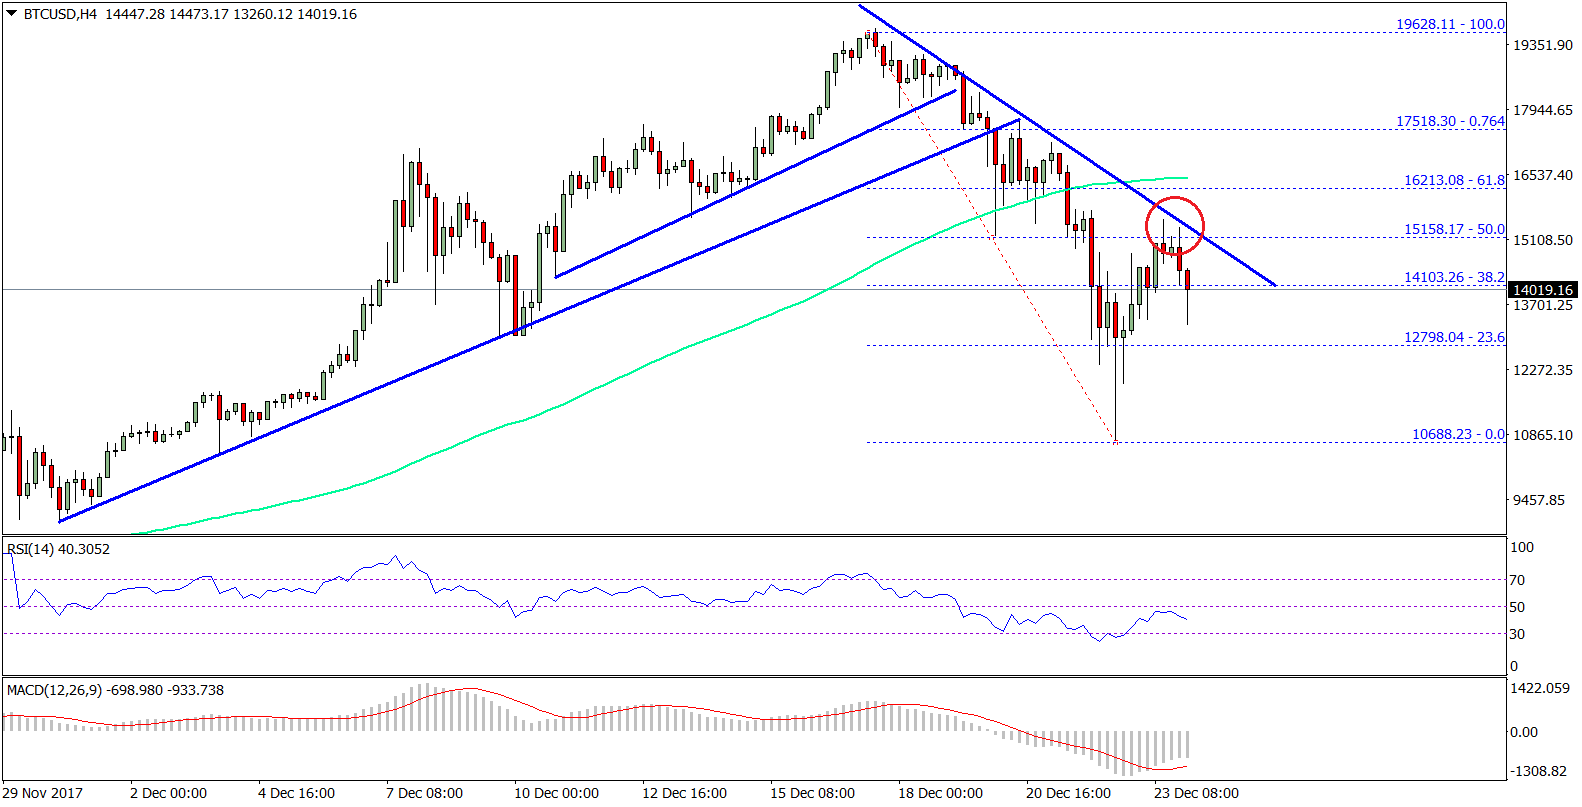
- There was a break below two important bullish trend lines with support near $17,800 on the 4-hours chart of BTC/USD (data feed from SimpleFX).
- The pair is currently recovering, but it is facing a major resistance near the $15,500 level.
Bitcoin price declined sharply toward $10,000 against the US Dollar. BTC/USD is currently recovering, but it is facing a lot of selling pressure.
Bitcoin Price Resistance
After a great upside run toward the $20,000 level, bitcoin price faced selling pressure against the US Dollar. There was a sharp decline below the $18,000 and $15,000 support levels. More importantly, there was a break below two important bullish trend lines with support near $17,800 on the 4-hours chart of BTC/USD. These trend lines break opened the doors for more losses and the pair tumbled below the $12,000 level. A low was formed at $10,688 from a minor recovery wave was initiated.
The price has moved above the 23.6% Fib retracement level of the last decline from the $19,628 high to $10,688 low. However, there is a bearish trend line forming with current resistance at $15,150 on the same chart. Moreover, the 50% Fib retracement level of the last decline from the $19,628 high to $10,688 low is also acting as a major hurdle for buyers. As long as the trend line resistance is intact, the pair might continue to struggle. Only a close above the $15,500 would negate the bearish pressure and may call for more gains.
On the flip side, if the price continues to move down, then there can be more slides toward $12,500 in the near term.
Looking at the technical indicators:
4-hours MACD – The MACD is reducing its bearish slope.
4-hours RSI (Relative Strength Index) – The RSI is struggling to move higher and is below the 50 level.
Major Support Level – $12,500
Major Resistance Level – $15,500
Charts courtesy – SimpleFX


