Last week, we saw some pretty volatile action in the bitcoin price. It is unlikely that this week’s action will replicate the degree to which price moved last week, but that doesn’t mean we won’t be able to profit as and when we get any up and down momentum. Price generally corrects after a large sustained upside run like the one that we have seen, and over the weekend, we saw what looks to be the start of said correction. Whether it will continue, however, remains to be seen. We may have already seen the bottom, and if this is the case, early this week, we should see a continuation of the overarching bullish momentum.
Anyway, whatever happens, we are going to be ready with our intraday strategy so as to ensure that we can draw a profit from the market sent when price moves and in whatever direction.
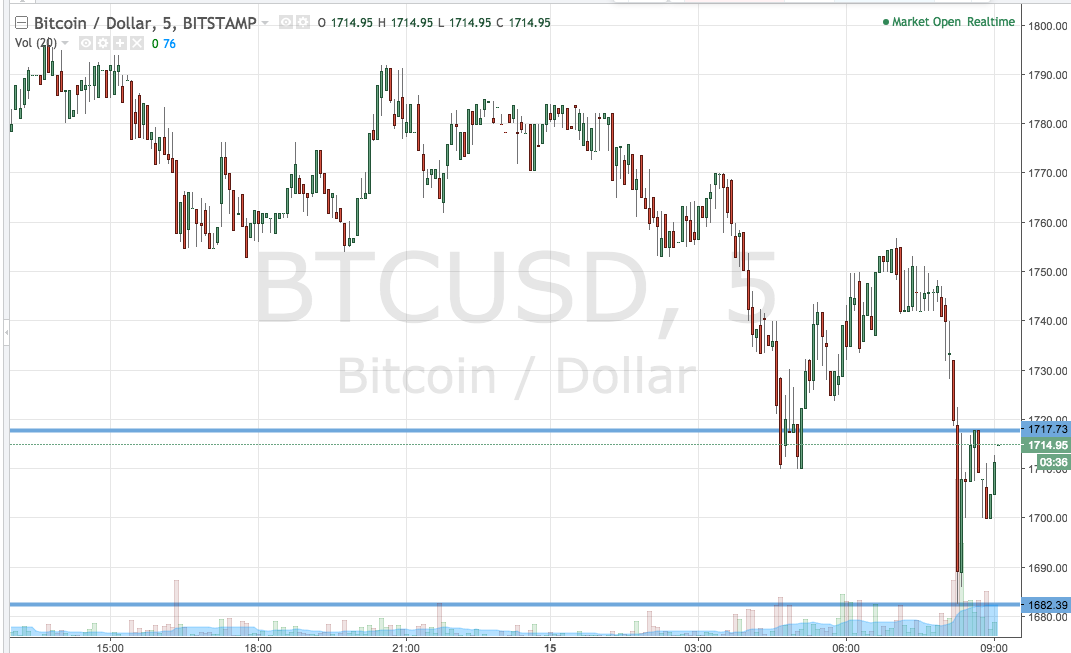
So, with this in mind, and as we head into the early morning session out of Europe today, here is a look at our key levels, and where we intend to get in and out of the markets according to the rules of our intraday strategy. As ever, take a quick look at the chart below before we get started. It is a five-minute candlestick chart, and it has our range overlaid in green.

As the chart shows, the range we are looking at today is defined by support to the downside at 1682 and resistance to the upside at 1718. Breakout only for now, so we’ll be in long on a close above resistance towards an immediate upside target of 1730 and short on a close below support towards a downside target of 1670. A stop loss just the other side of the entry on both positions will ensure we are taken out of the trade in the event of a bias reversal.
Charts courtesy of Trading View


