That’s the Monday session done out of Europe and it’s time for the US afternoon to take control of the lion’s share of the volume in the bitcoin price. We tried to set up against markets pretty tight today so as to ensure that we didn’t get chopped out on any volatility. When things start to move against the grain (as was the case when the European open initiated today and price bounced to reverse its corrective wave) they can get a bit choppy. This choppiness can result in unwanted stop loss activity and that – in return – can result in a net down day.
Turn out we were right to be cautious. Price is now trading in and around the 4000 key level and we’ve not had too many opportunities to get in and out of the markets according to the rules of our intraday strategy. We’re still on top, but we’d love to see a bit of movement in line with our bias as opposed to against it.
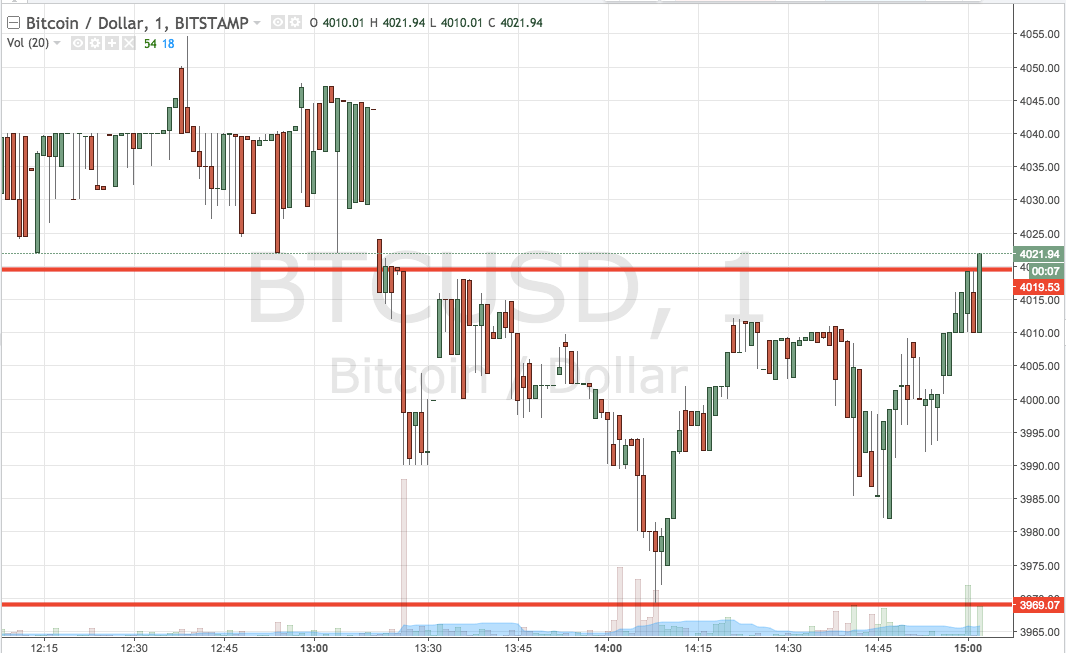
So, with this out of the way, let’s get some levels in place with which we can carry forward into the session today. As ever, take a quick look at the chart below before we get started. It’s a one-minute candlestick chart and it’s got our range overlaid in red.

As the chart shows, the range we are looking at for the session today comes in as defined by resistance to the upside at 4019 and support to the downside at 3969. We will initially look for a close above the former to validate an upside entry towards a target of 4050. Looking the other way, a close below support will have us in short towards 3950.
Stops on both positions a few points either side of the entry will ensure we get taken out in a timely fashion if things turn around.
Let’s see how things play out.
Charts courtesy of Trading View


