
Reason to trust
How Our News is Made
Strict editorial policy that focuses on accuracy, relevance, and impartiality
Ad discliamer
Morbi pretium leo et nisl aliquam mollis. Quisque arcu lorem, ultricies quis pellentesque nec, ullamcorper eu odio.
Bitcoin price declined over 10% and it traded close to the $10,000 support against the US Dollar. BTC might correct higher, but upsides are likely to remain capped near $10,800.
- Bitcoin started a strong decline and it weakened over $1,000 in the past three sessions.
- The price is down over 10%, and it broke the $10,500 support and the 100 hourly simple moving average.
- There is a key bearish trend line forming with resistance near $10,750 on the hourly chart of the BTC/USD pair (data feed from Kraken).
- The pair is currently consolidating losses near $10,250 and it might correct higher in the short-term.
Bitcoin Price Nosedives $1,000
Yesterday, we saw a sharp bearish wave in bitcoin price below the $11,500 support against the US Dollar. BTC remained in a bearish zone and it broke many supports such as $11,000 and $10,800.
The price is down over 10%, and it broke the $10,500 support and the 100 hourly simple moving average. A low is formed near $10,039 and the price is currently consolidating losses. An initial resistance on the upside is near the $10,400 level.
The 23.6% Fib retracement level of the recent drop from the $11,484 high to $10,039 low is near the $10,380 level to act as a resistance. The next key resistance is near the $10,500 level (a multi-touch zone).
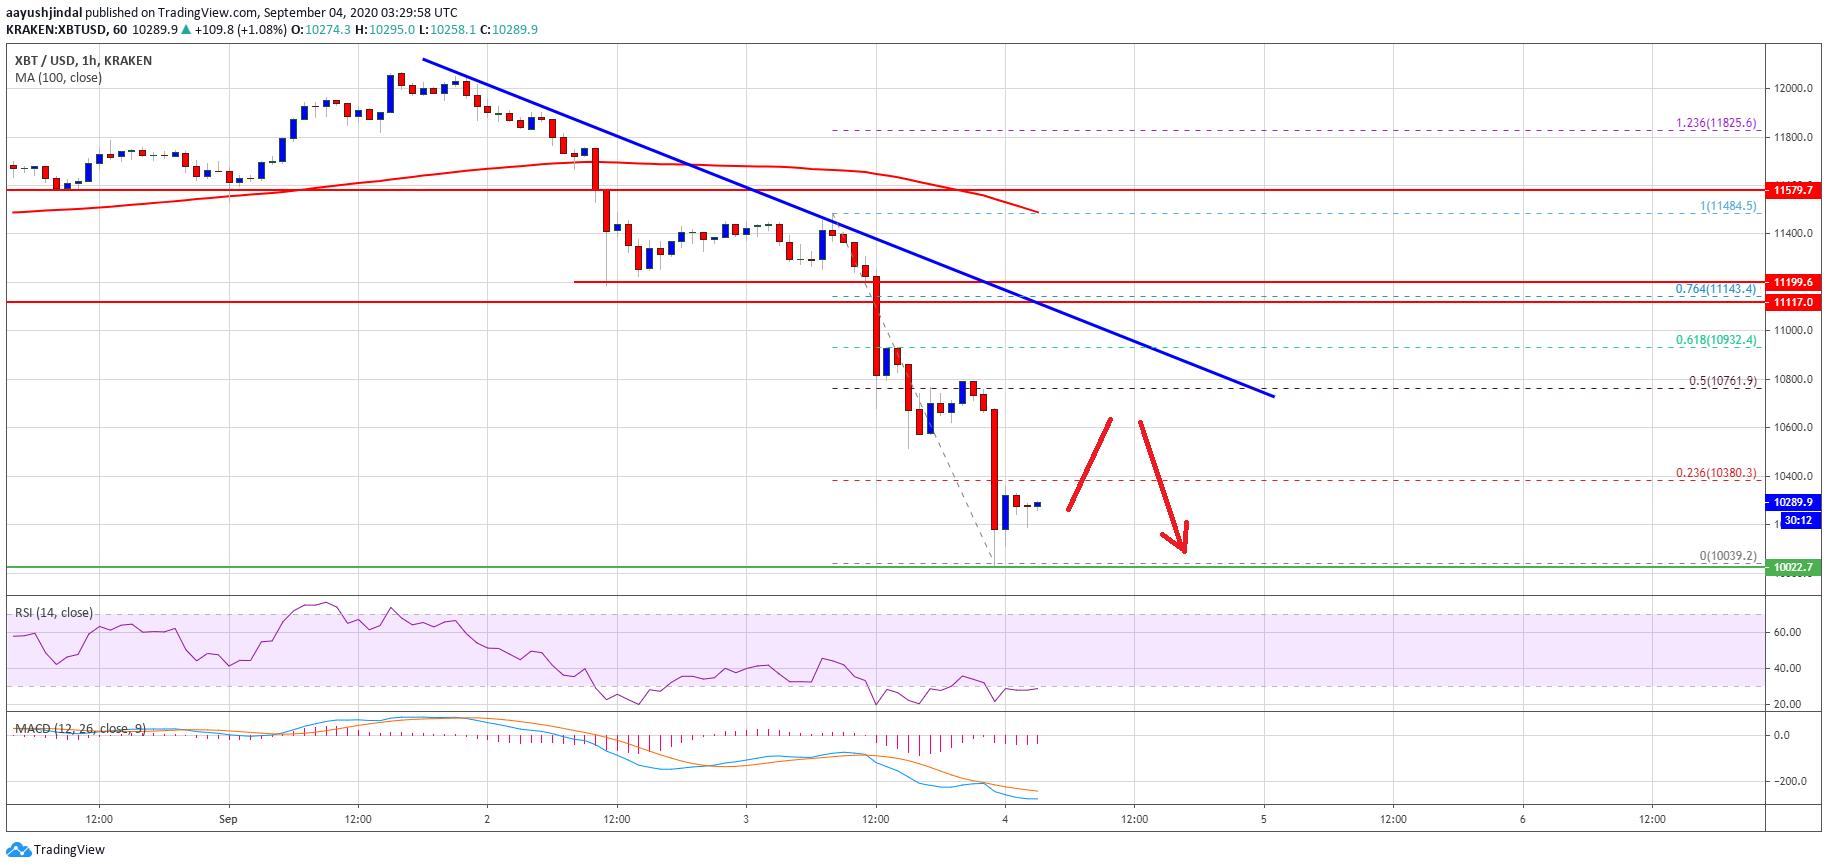
Bitcoin price trades below $10,500. Source: TradingView.com
The main resistance is now forming near the $10,800 level. There is also a key bearish trend line forming with resistance near $10,750 on the hourly chart of the BTC/USD pair. The trend line is close to the 50% Fib retracement level of the recent drop from the $11,484 high to $10,039 low.
A successful break above the $10,500 level and then a follow up move above the $10,800 level is needed to move back into a positive zone in the near term.
More Losses in BTC
If bitcoin price struggles to clear the $10,500 resistance, it might continue to move down. The first key support for the bulls is near the $10,050 level.
The main support is near the $10,000 area, below which there is an open space and the price might decline another 5%-10%.
Technical indicators:
Hourly MACD – The MACD is slowly losing momentum in the bearish zone.
Hourly RSI (Relative Strength Index) – The RSI for BTC/USD is now well below the 40 level.
Major Support Levels – $10,050, followed by $10,000.
Major Resistance Levels – $10,400, $10,500 and $10,800.


