
Reason to trust
How Our News is Made
Strict editorial policy that focuses on accuracy, relevance, and impartiality
Ad discliamer
Morbi pretium leo et nisl aliquam mollis. Quisque arcu lorem, ultricies quis pellentesque nec, ullamcorper eu odio.
Bitcoin price failed to stay above the $10,750 support and declined sharply against the US Dollar. BTC is holding the $10,200 support, but there is a risk of more downsides.
- Bitcoin is down 5% and it broke the $10,750 and $10,550 support levels.
- The price is holding the $10,300 region, but it is well below the 100 hourly simple moving average.
- There is a major contracting triangle forming with resistance near $10,470 on the hourly chart of the BTC/USD pair (data feed from Kraken).
- The pair could correct higher, but the $10,550 zone is now likely to act as a strong resistance.
Bitcoin Price Dives 5%
After a couple of failed attempts near $11,000, bitcoin price started a fresh decline against the US Dollar. BTC broke the $10,750 support level to start a substantial decline.
There was also a break below the key $10,550 support and the 100 hourly simple moving average. The price traded close to the $10,200 support and a low is formed near $10,302. Bitcoin is currently correcting higher and trading above the $10,400 level.
There was a break above the 23.6% Fib retracement level of the recent dive from the $10,989 high to $10,302 low. It seems like there is a major contracting triangle forming with resistance near $10,470 on the hourly chart of the BTC/USD pair.
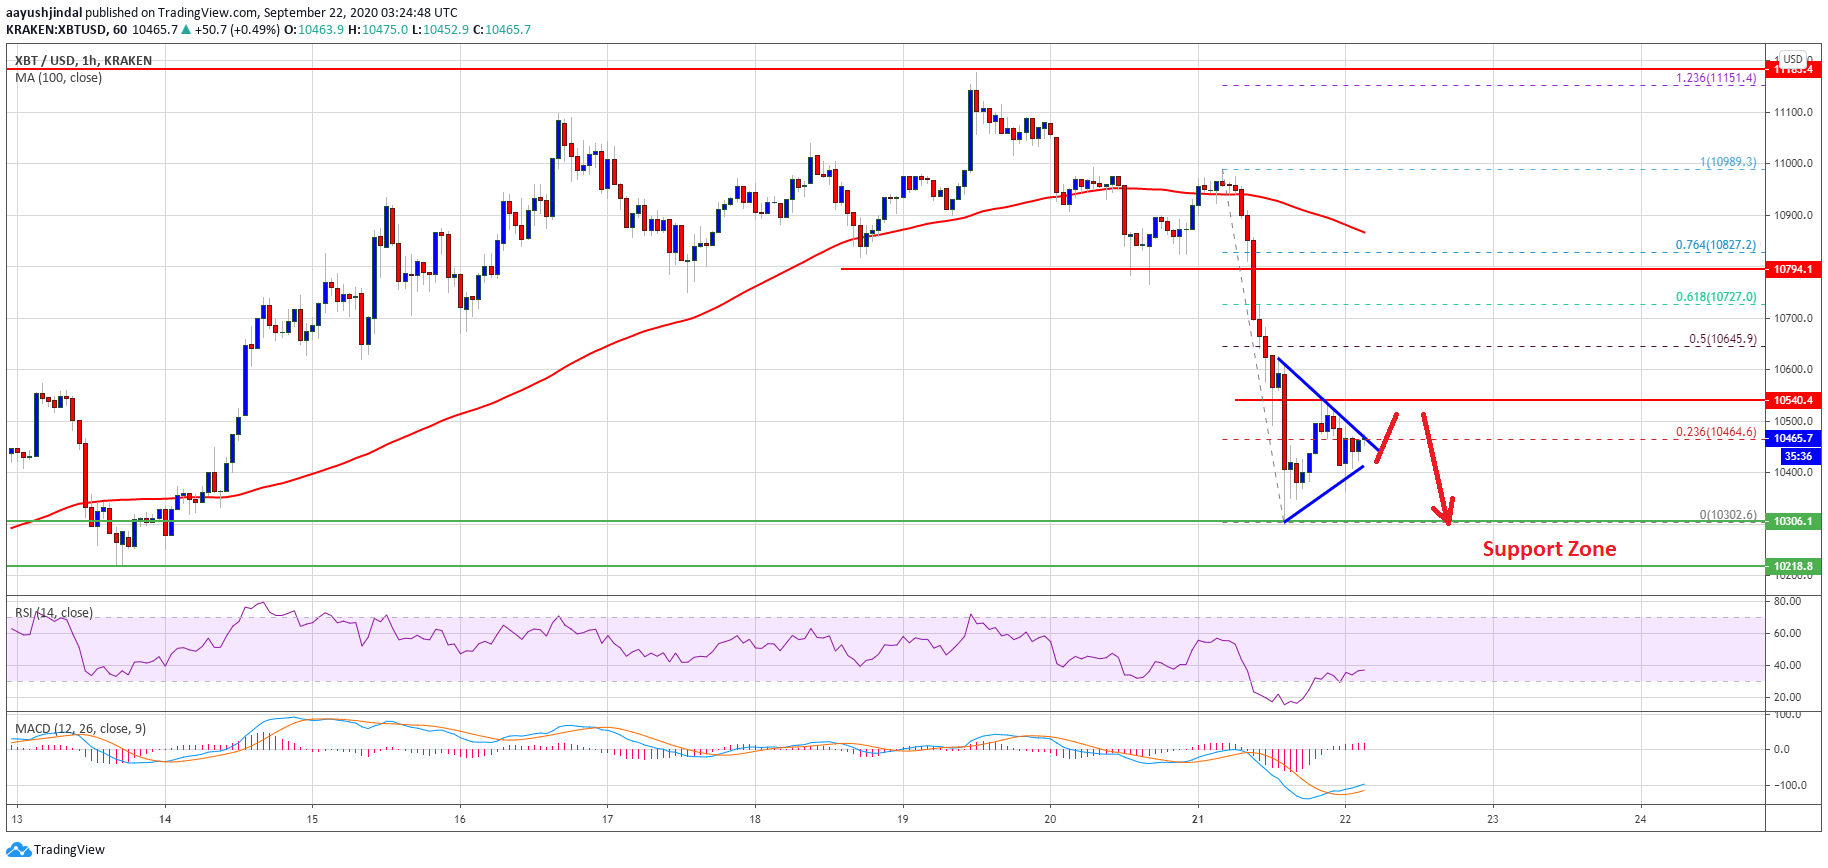
Bitcoin price dives below $10,555. Source: TradingView.com
If there is an upside break, the price could test the $10,550 resistance (support turned resistance). The next major resistance is near the $10645 level since it is close to the 50% Fib retracement level of the recent dive from the $10,989 high to $10,302 low. The main resistance is now near the $10,800 zone and the 100 hourly simple moving average.
Risk of More Losses in BTC?
If bitcoin fails to recover above the $10,550 and $10,650 levels, there is a risk of more losses. An initial support is near the recent low and $10,300.
The main support on the downside is near the $10,200 zone, where the bulls might take a strong stand. However, if the current bearish pressure remains intact, there could be a sharp decline below $10,200 and $10,000.
Technical indicators:
Hourly MACD – The MACD is slowly moving in the bullish zone.
Hourly RSI (Relative Strength Index) – The RSI for BTC/USD is recovering and approaching the 40 level.
Major Support Levels – $10,300, followed by $10,200.
Major Resistance Levels – $10,550, $10,645 and $10,800.