Reason to trust
How Our News is Made
Strict editorial policy that focuses on accuracy, relevance, and impartiality
Ad discliamer
Morbi pretium leo et nisl aliquam mollis. Quisque arcu lorem, ultricies quis pellentesque nec, ullamcorper eu odio.
Cardano’s price traded to a new multi-month high at $1.48 before correcting lower. ADA declined sharply below $1.20, but the bulls were active above $1.18.
- ADA surged above the $1.20 and $1.40 resistance levels against the US dollar.
- The price is still trading well above $1.20 and the 100 simple moving average (4-hours).
- There is a key bullish trend line forming with support near $1.17 on the 4-hours chart of the ADA/USD pair (data source from Bitfinex).
- The pair could dip again towards $1.17 before it starts a fresh increase in the near term.
Cardano (ADA) Remains Strong Uptrend
In the past few days, cardano’s price started a strong increase above the $1.00 resistance. ADA price even cleared the $1.20 resistance and settled well above the 100 simple moving average (4-hours).
There was also a break above the $1.40 level and the price traded to a new multi-month high $1.487. Recently, there was a downside correction below the $1.350 and $1.300 levels. There was also a break below the $1.25 support level.
The price also declined below the 50% Fib retracement level of the upward move from the $0.9882 low to $1.487 high. However, the price remained well bid above the $1.750 zone.
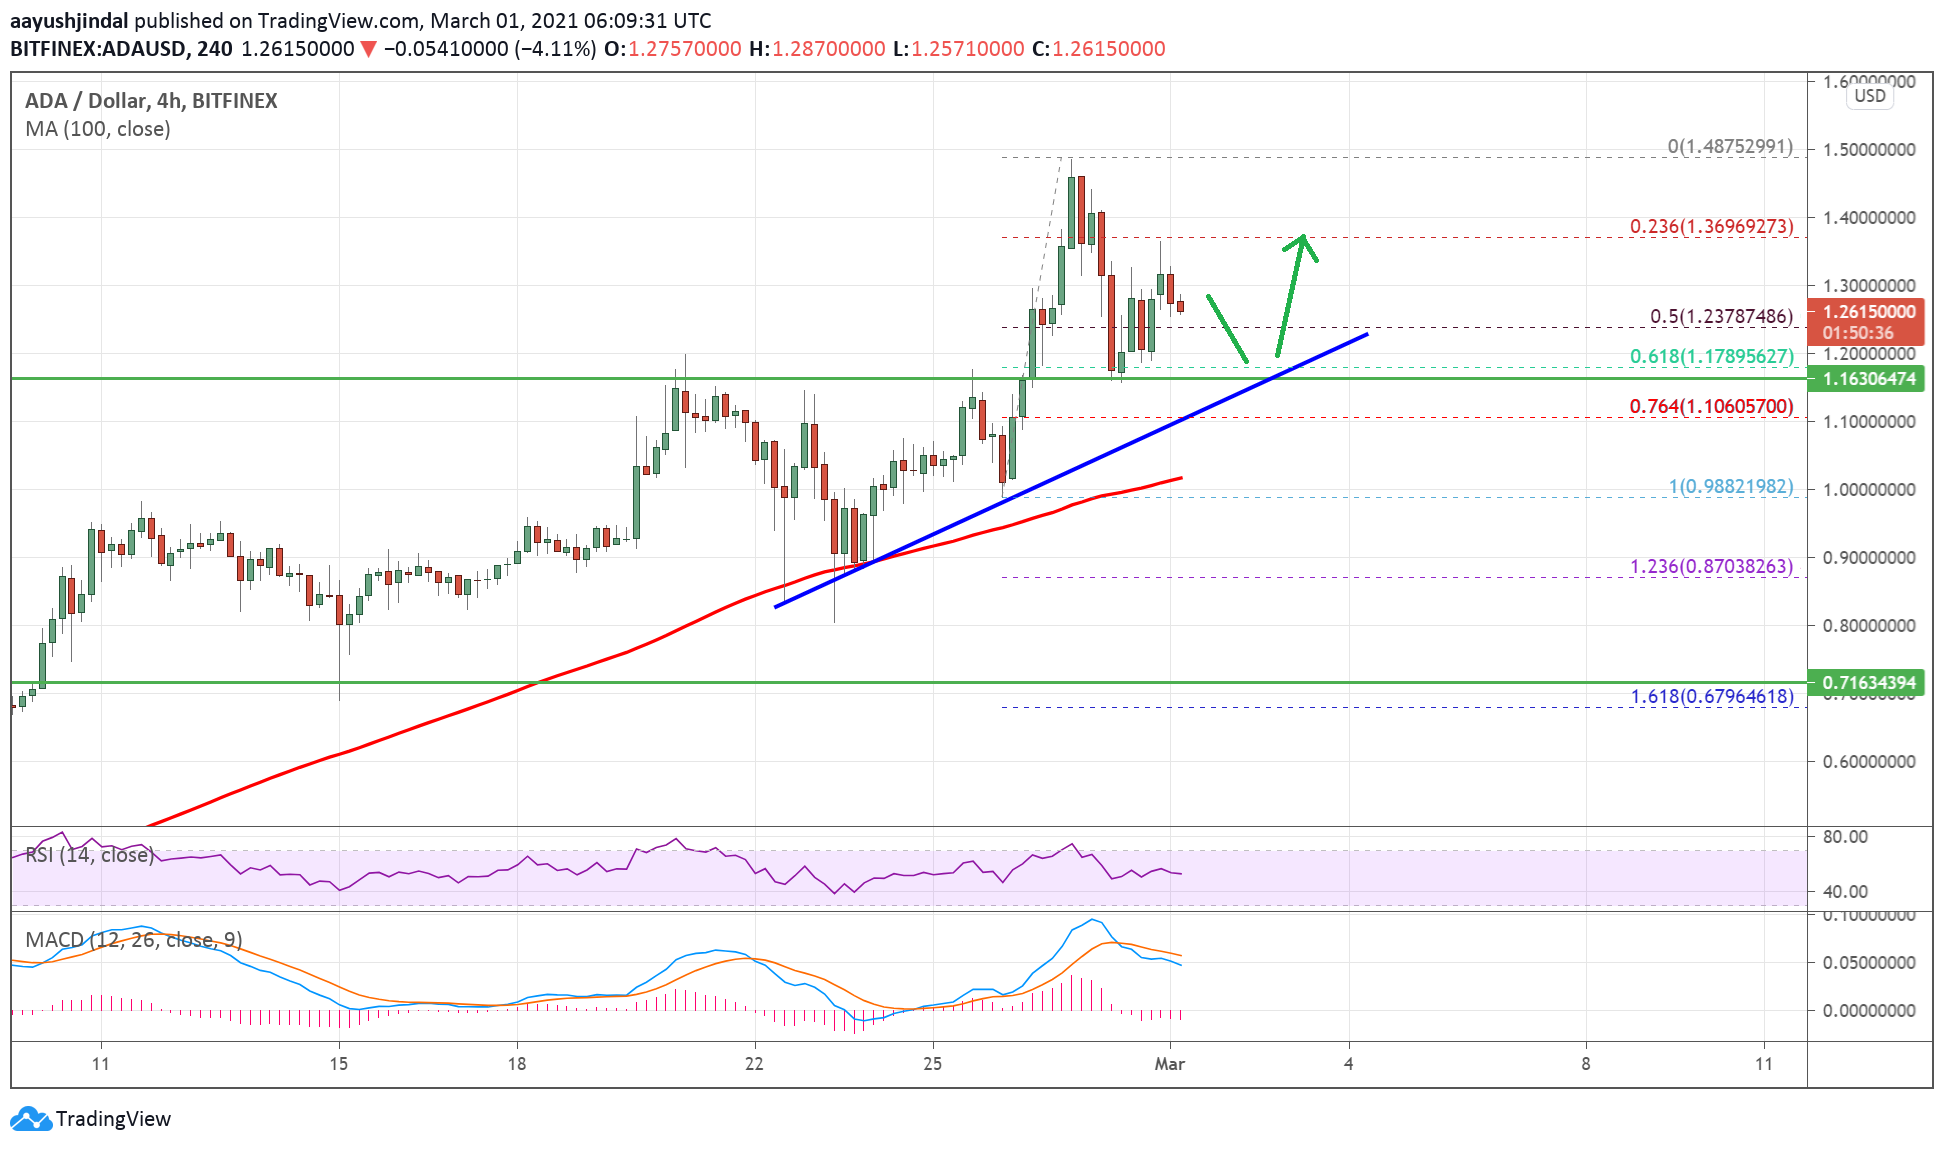
Source: ADAUSD on TradingView.com
There is also a key bullish trend line forming with support near $1.17 on the 4-hours chart of the ADA/USD pair. The trend line is close to the 61.8% Fib retracement level of the upward move from the $0.9882 low to $1.487 high.
On the upside, the price is facing resistance near the $1.30 and $1.35 levels. A clear break above the $1.35 zone could open the doors for a move towards the $1.40 and $1.45 levels. Any more gains could lead the price towards the $1.50 levels.
Dips Supported?
If cardano’s price fails to clear the $1.35 and $1.40 resistance levels, it could again correct lower. An initial support is near the $1.200 level.
The main support is now forming near the $1.750 level and the 100 simple moving average (4-hours). Any more losses below $1.7500 might risk of a break below $1.00.
Technical Indicators
4-hours MACD – The MACD for ADA/USD is struggling to gain momentum in the bullish zone.
4-hours RSI (Relative Strength Index) – The RSI for ADA/USD is currently stable above the 50 level.
Major Support Levels – $1.20, $1.75 and $1.10.
Major Resistance Levels – $1.35, $1.40 and $1.50.