Reason to trust

How Our News is Made
Strict editorial policy that focuses on accuracy, relevance, and impartiality
Ad discliamer
Morbi pretium leo et nisl aliquam mollis. Quisque arcu lorem, ultricies quis pellentesque nec, ullamcorper eu odio.
Mantra has just gone through a crash that has wiped out most of its value. Here’s how on-chain metrics have changed during this collapse.
Mantra Has Seen A Reaction In Several On-Chain Indicators
In a new post on X, the on-chain analytics firm Glassnode has discussed about the sudden price plunge that Mantra saw in the past day. During this crash, the asset’s value went from above $6 to around $0.50 in the matter of a few hours.
First, here is how the Exchange Inflow (that is, the total amount of OM being transferred to centralized exchanges) changed along with this volatile move:

As displayed in the above graph, Mantra interestingly didn’t see any large spikes in the indicator in the leadup to the crash. Investors use exchanges for selling-related purposes, so large deposits tend to appear before intense volatility.
In OM’s case, though, it seems there were no such inflows. Large deposits have still occurred in the past day, but they only came after the collapse was already over. These late inflows likely corresponded to reactionary moves from the investors.
The opposite indicator, the Exchange Outflow, also saw spikes following the price plummet, as the below chart shows.

While the largest withdrawals only came after the crash was over, there were some significant outflows also made before the low was reached. “This could reflect withdrawals post-liquidation, opportunistic buys followed by self-custody, or exchanges reducing exposure,” explains the analytics firm.
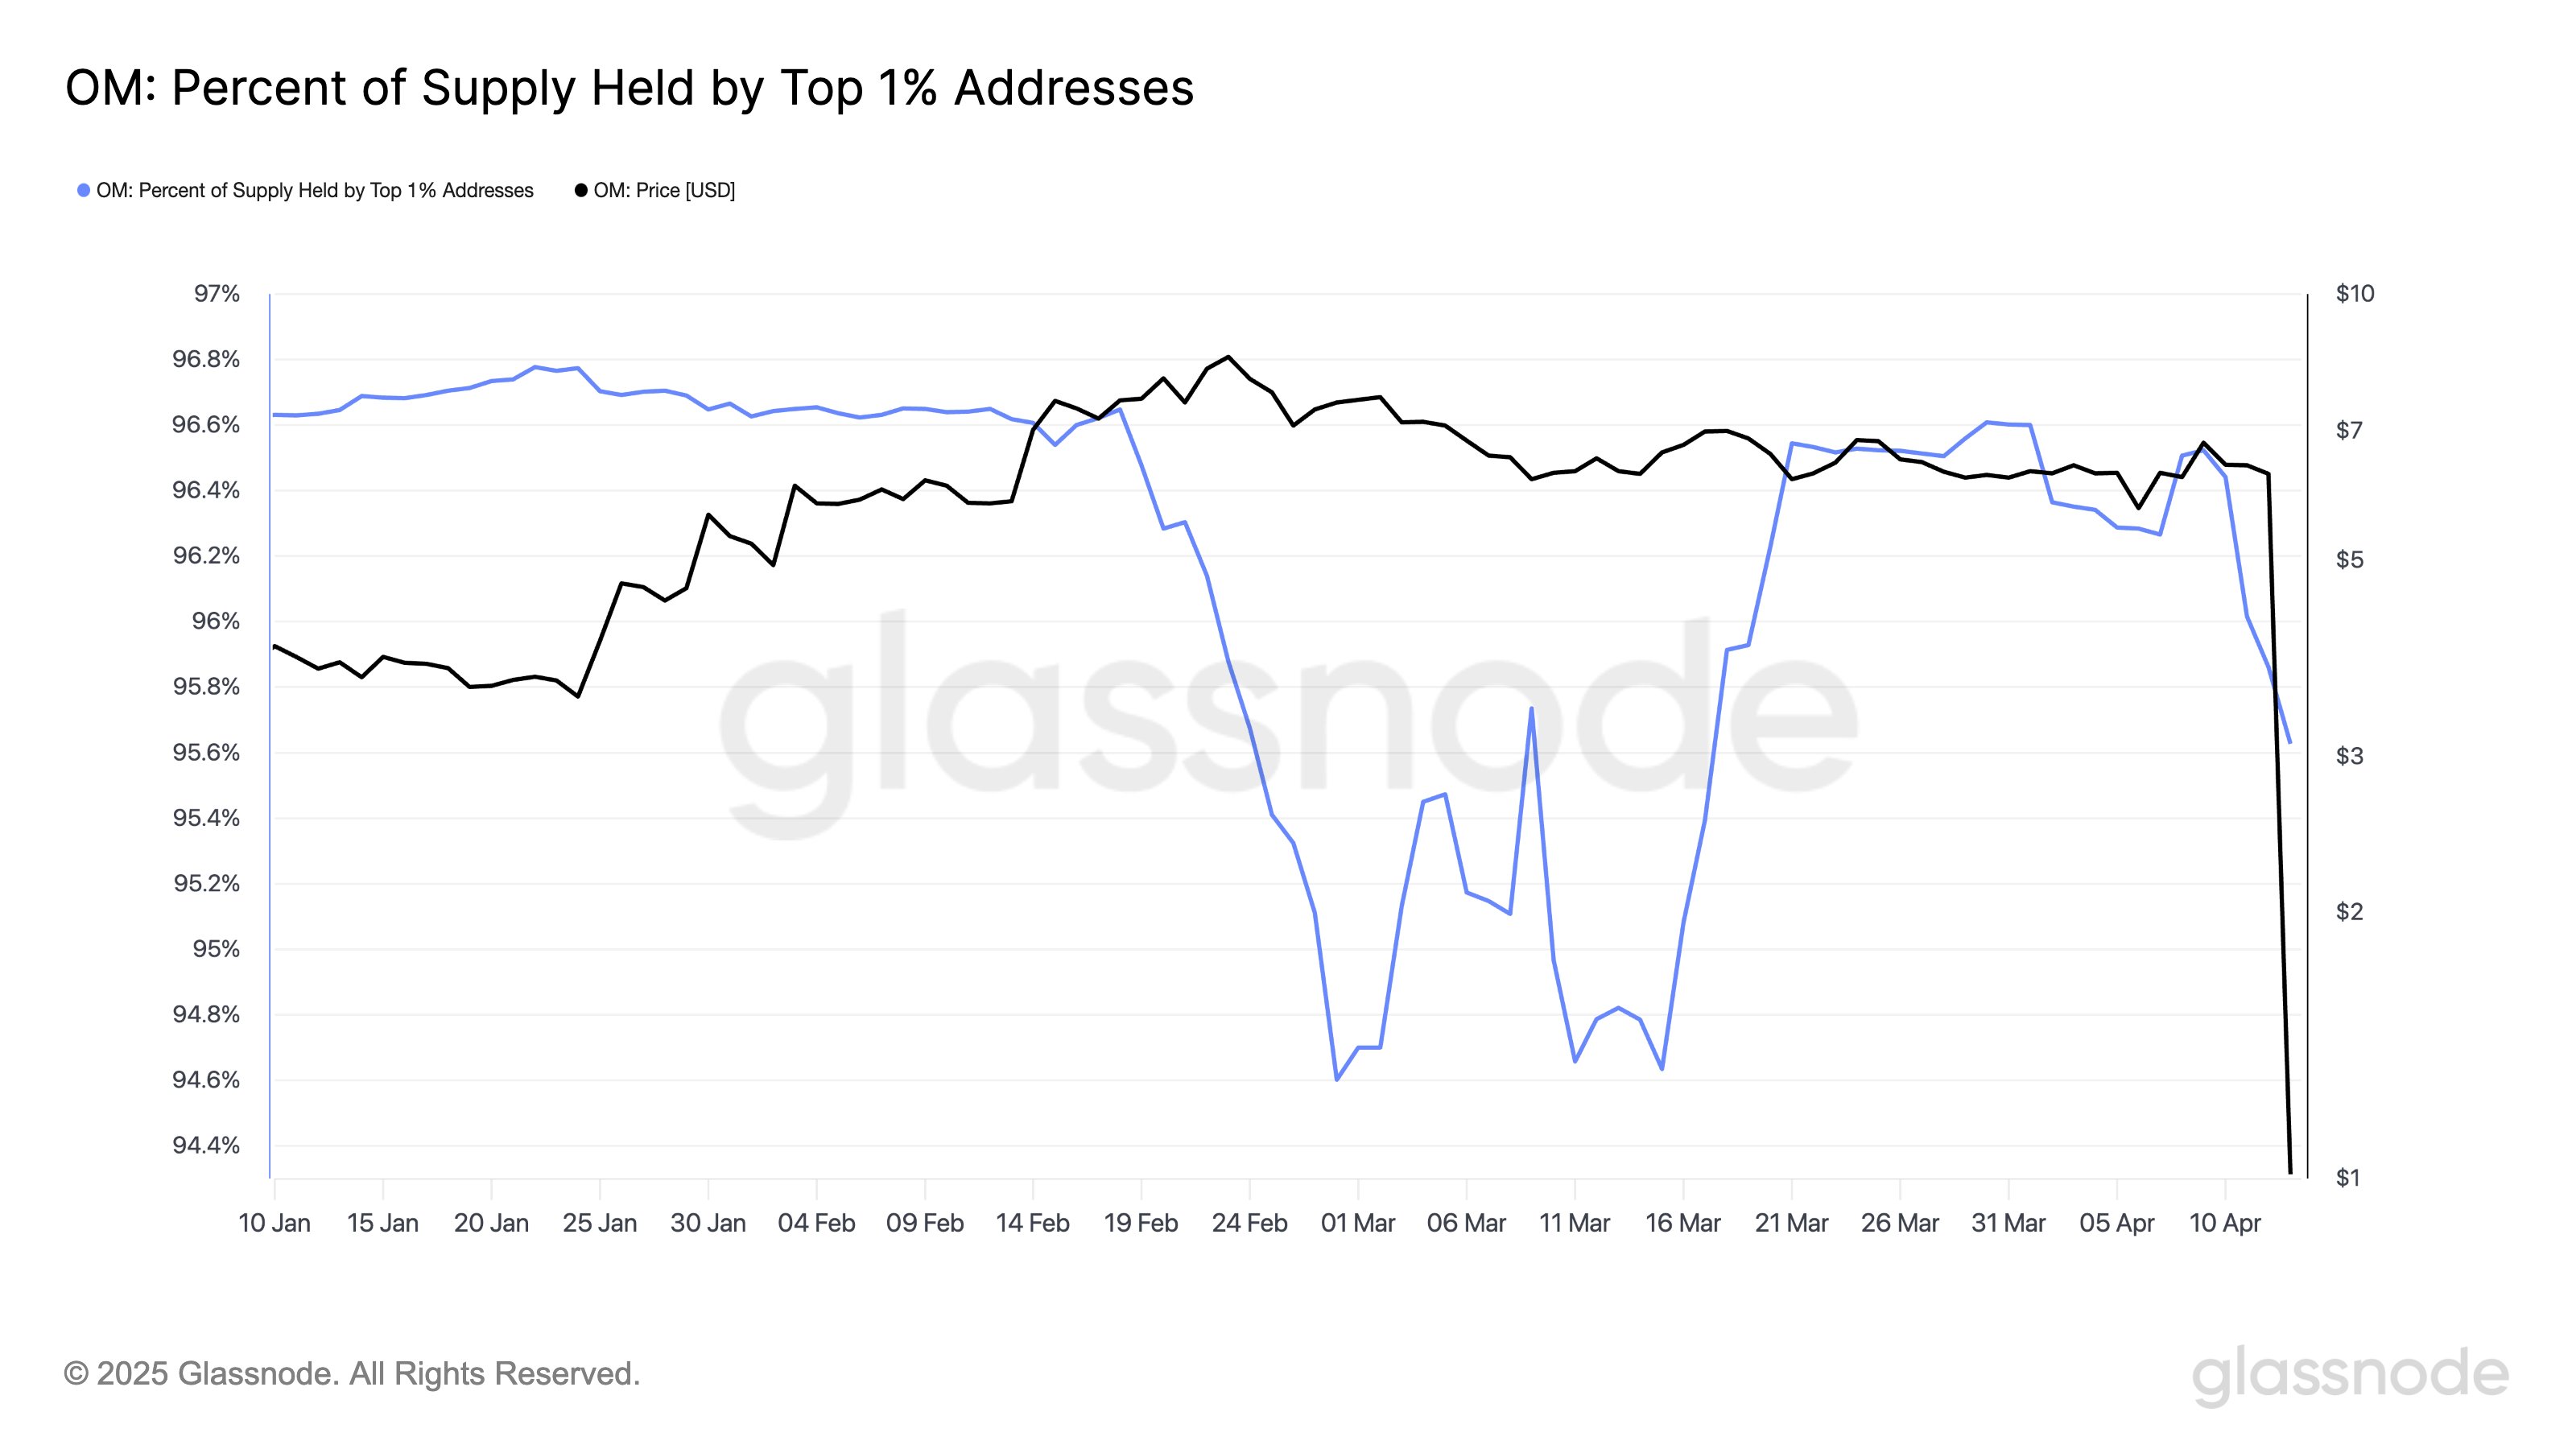
A metric that did register a change ahead of time was the percentage of the Mantra supply held by the top 1% addresses.

The top 1% addresses reduced their supply share from 96.4% to 95.6% before the OM collapse took place. “While not the largest drop in recent months, it’s notable,” notes Glassnode.
Another indicator that showcases the market panic is the Number of Transfers, which observed a huge spike as OM went through its volatility.

The Number of Transfers peaked at around 1,400 inside a 10-minute window. Given the scale involved, it’s likely that a large amount of traders were responsible for these moves.
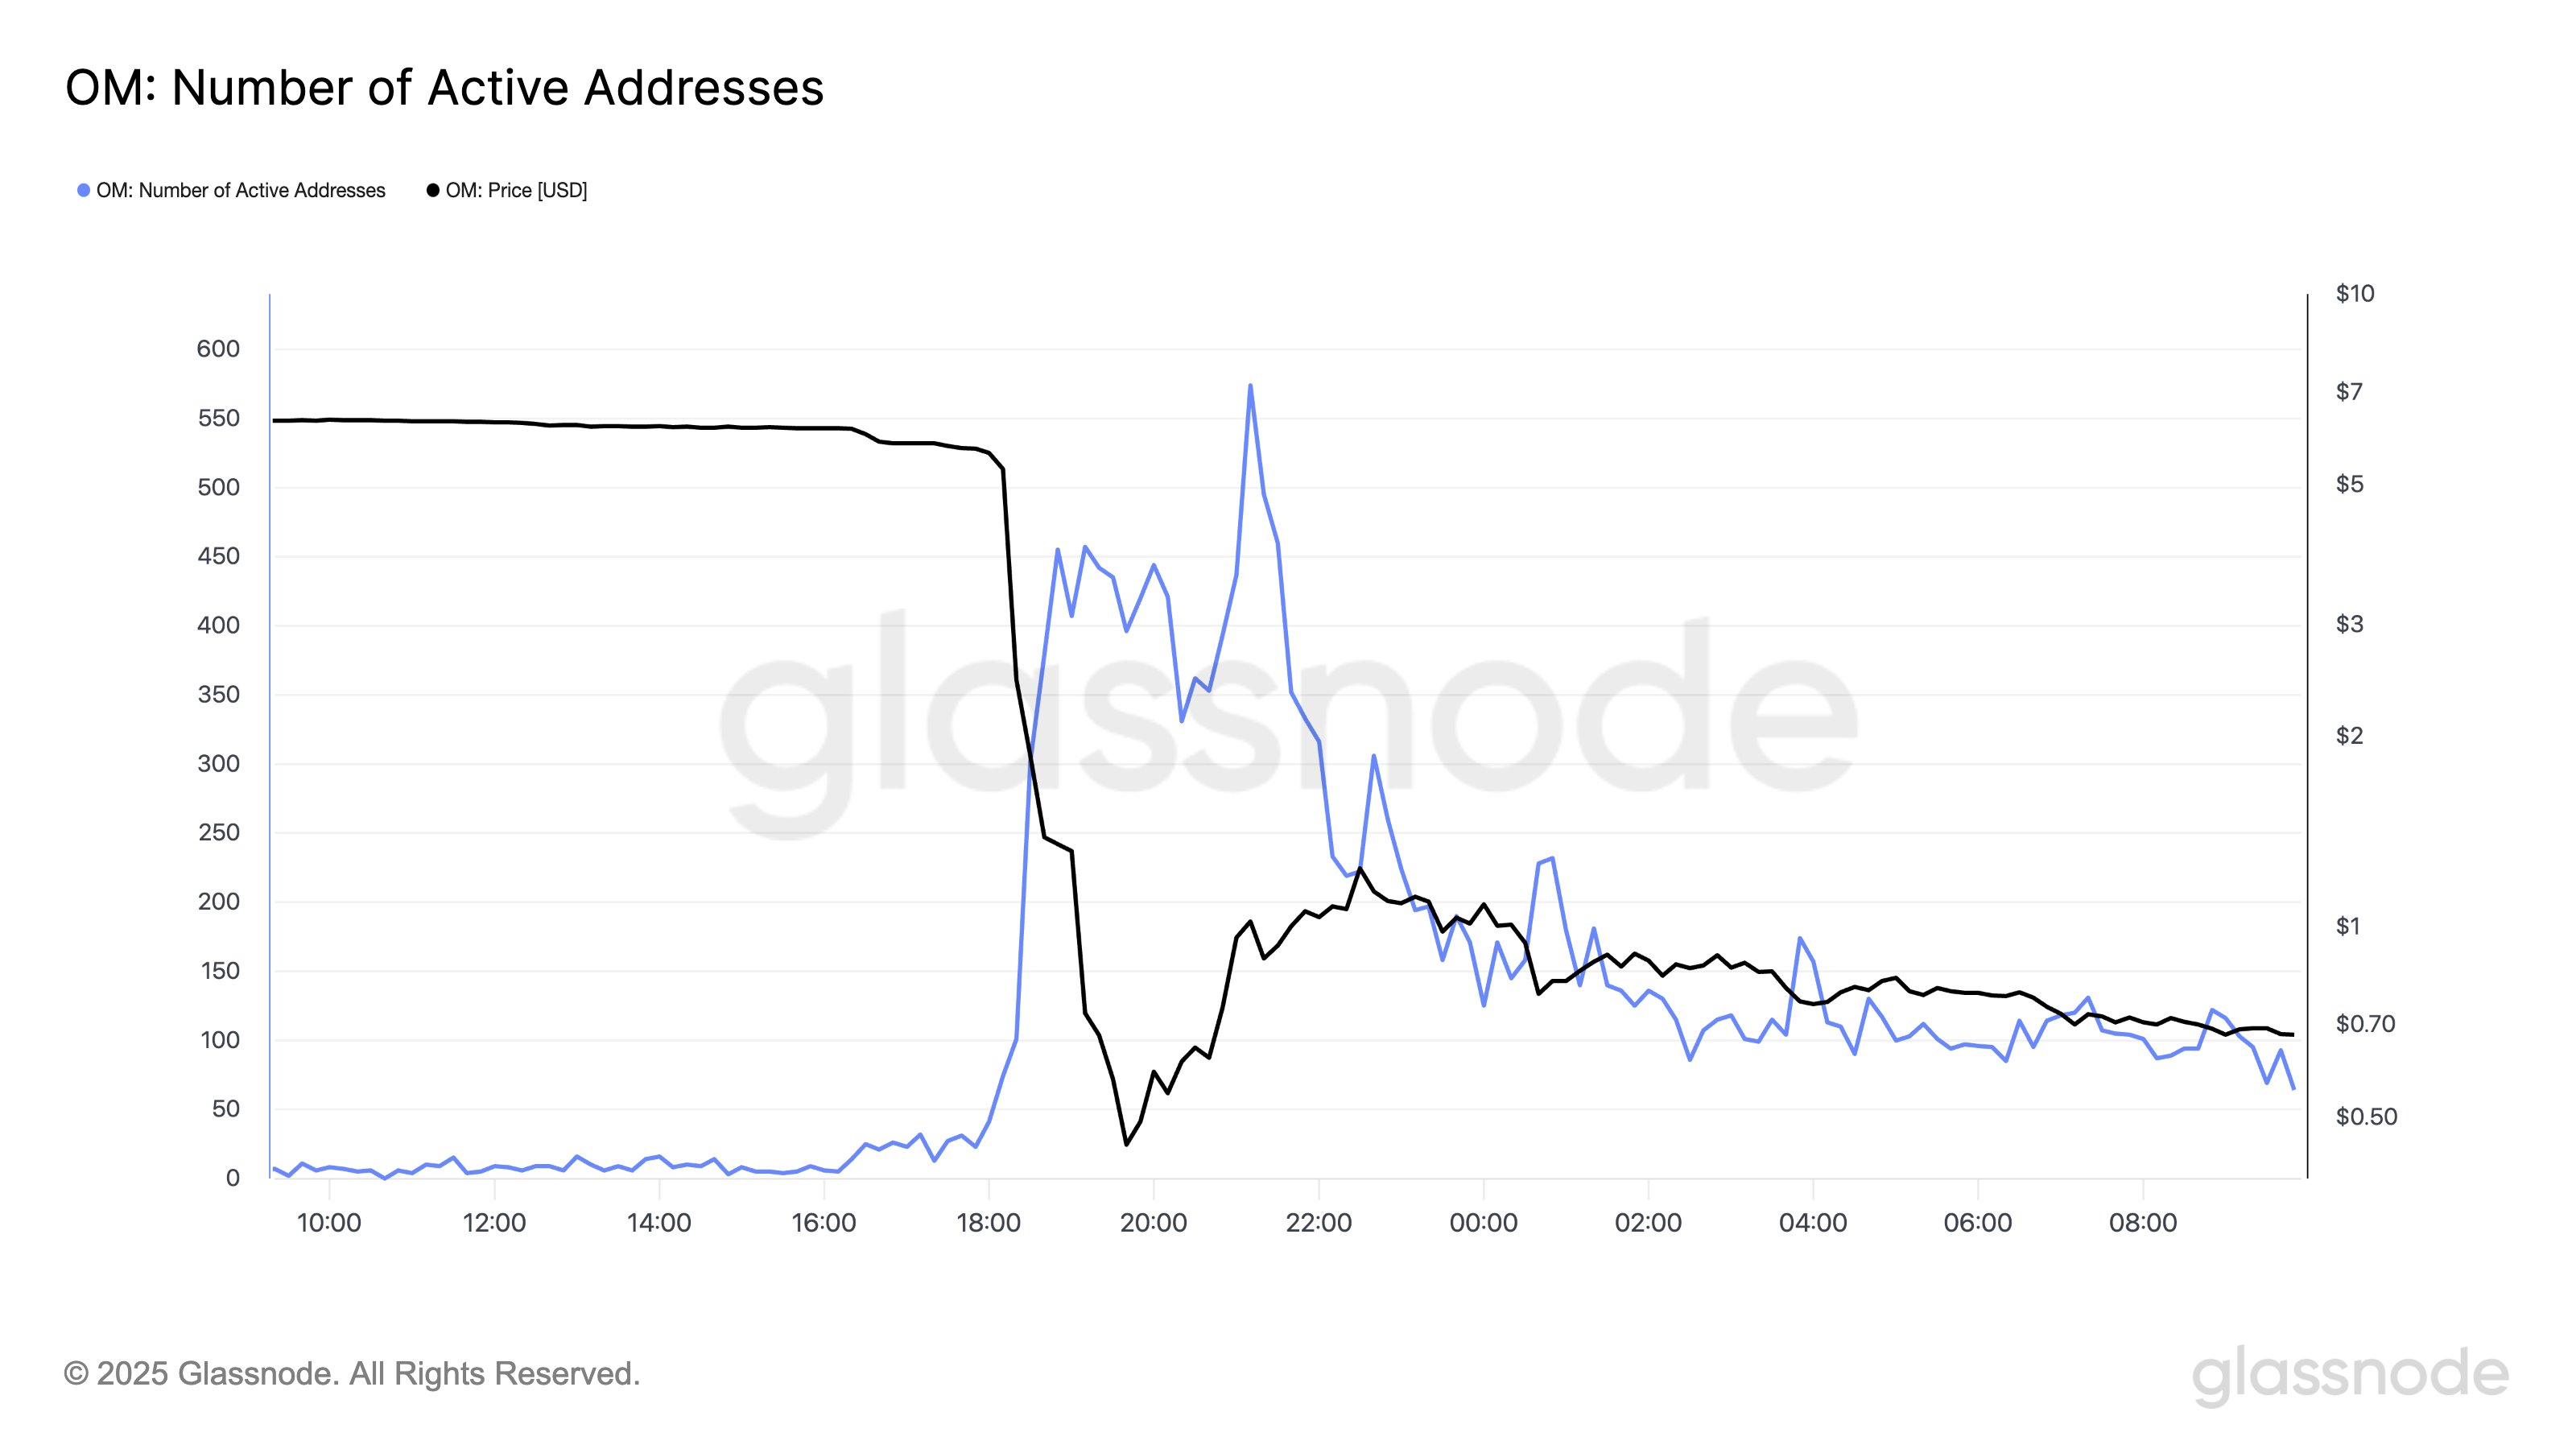
And indeed, the trend in the Active Addresses, a metric keeping track of the number of addresses becoming involved in transactions on the chain, would confirm this.

From the chart, it’s apparent that the Active Addresses mimicked the trend in the Number of Transfers very closely, so the Mantra selloff wasn’t contained to a few addresses at all.
OM Price
At the time of writing, Mantra is trading around $0.50, down more than 91% in the past day.


