Bitcoin has traded in a relatively tight $2,000 range over the past two months after a rejection in the $12,000 region. The slow price action in the leading cryptocurrency also comes as legacy markets, such as the S&P 500 and precious metals, have undergone some stagnation.
Bitcoin’s inability to break higher after retaking crucial long-term supports has led some investors to fear that the cryptocurrency market is primed to see a strong reversal lower.
Fortunately for bulls, it was just confirmed that a long-term uptrend signal just recently confirmed that should indicate more upside is to come. The signal was last formed in 2014, prior to the bull trend that took Bitcoin to $20,000 from the hundreds.
Related Reading: Ethereum Transaction Fees Surge to All-Time Highs After Uniswap Launch
Bitcoin Forms Crucial Long-Term Uptrend Signal
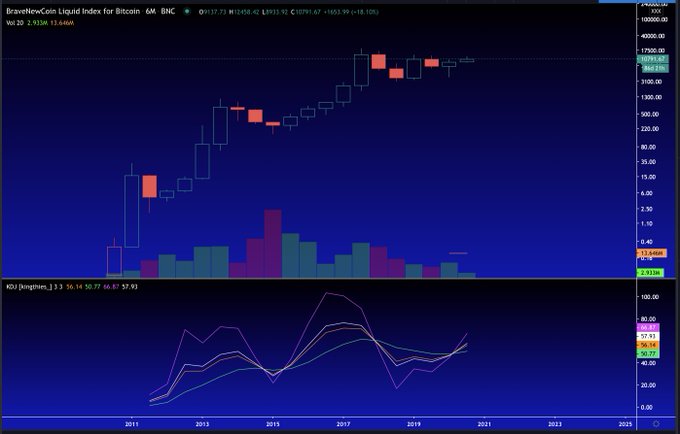
Crypto-asset analysis Eric Thies noted on October 5th that in July, Bitcoin formed a pivotal long-term uptrend signal that few noticed. The cryptocurrency’s six-month KDJ formed a bullish crossover for the first time since 2014, when BTC was trading for a few hundred dollars.
The KDJ is a technical signal derived from the Stochastic Oscillator, meaning it shows when an asset is either overbought or oversold over the time frame being analyzed. This latest crossover shows that bulls currently are in control.
Thies commented further on the significance of the recent formation of this signal:
“Notes on this crazy high TF but I’ll gladly give hopium when I see it 6M KDJ crossed bullish when it closed in July, confirming an unmistakably bullish 6M hammer at the same time. Last time KDJ crossed bull was 2014 with a $200 $BTC low. Last cross bear at $17k high.”
Of note, it seems as though the volume on Bitcoin’s six-month candles is getting progressively weaker. This may just be a byproduct of the ongoing introduction of new exchanges that do not fit into BraveNewCoin’s Liquid Index, which is what the chart below depicts.
Chart of BTC's price action since it became a tradable asset with a KDJ analysis by crypto trader Eric "King" Thies. Chart from TradingView.com
Related Reading: Critical On-Chain Signal Predicts That Bitcoin’s Next Move Will Be Upward
Fundamentals Corroborate Upside Chances
The long-term fundamentals corroborate the expectations of upside in the Bitcoin price.
CryptoQuant, a crypto-asset analytics firm, reported that ten out of eleven of its long-term Bitcoin on-chain signals are currently forming “buy” or “strong buy” signals. These signals include but are not limited to, the Hash Ribbons, the MVRV Ratio, Stock to Flow Ratio, Stablecoin Supply Ratio, and Miners’ Position Index.
Long-term $BTC on-chain indicators look healthyhttps://t.co/VnrIVP3lDF pic.twitter.com/cfE73acVXh
— CryptoQuant.com (@cryptoquant_com) September 16, 2020
Related Reading: MicroStrategy’s Stock Continues to Soar After BTC Purchase
Featured Image from Shutterstock
Price tags: xbtusd, btcusd, btcusdt
Charts from TradingView.com
Bitcoin Forms Pivotal Long-Term Uptrend Signal Last Seen in 2014


