Reason to trust
How Our News is Made
Strict editorial policy that focuses on accuracy, relevance, and impartiality
Ad discliamer
Morbi pretium leo et nisl aliquam mollis. Quisque arcu lorem, ultricies quis pellentesque nec, ullamcorper eu odio.
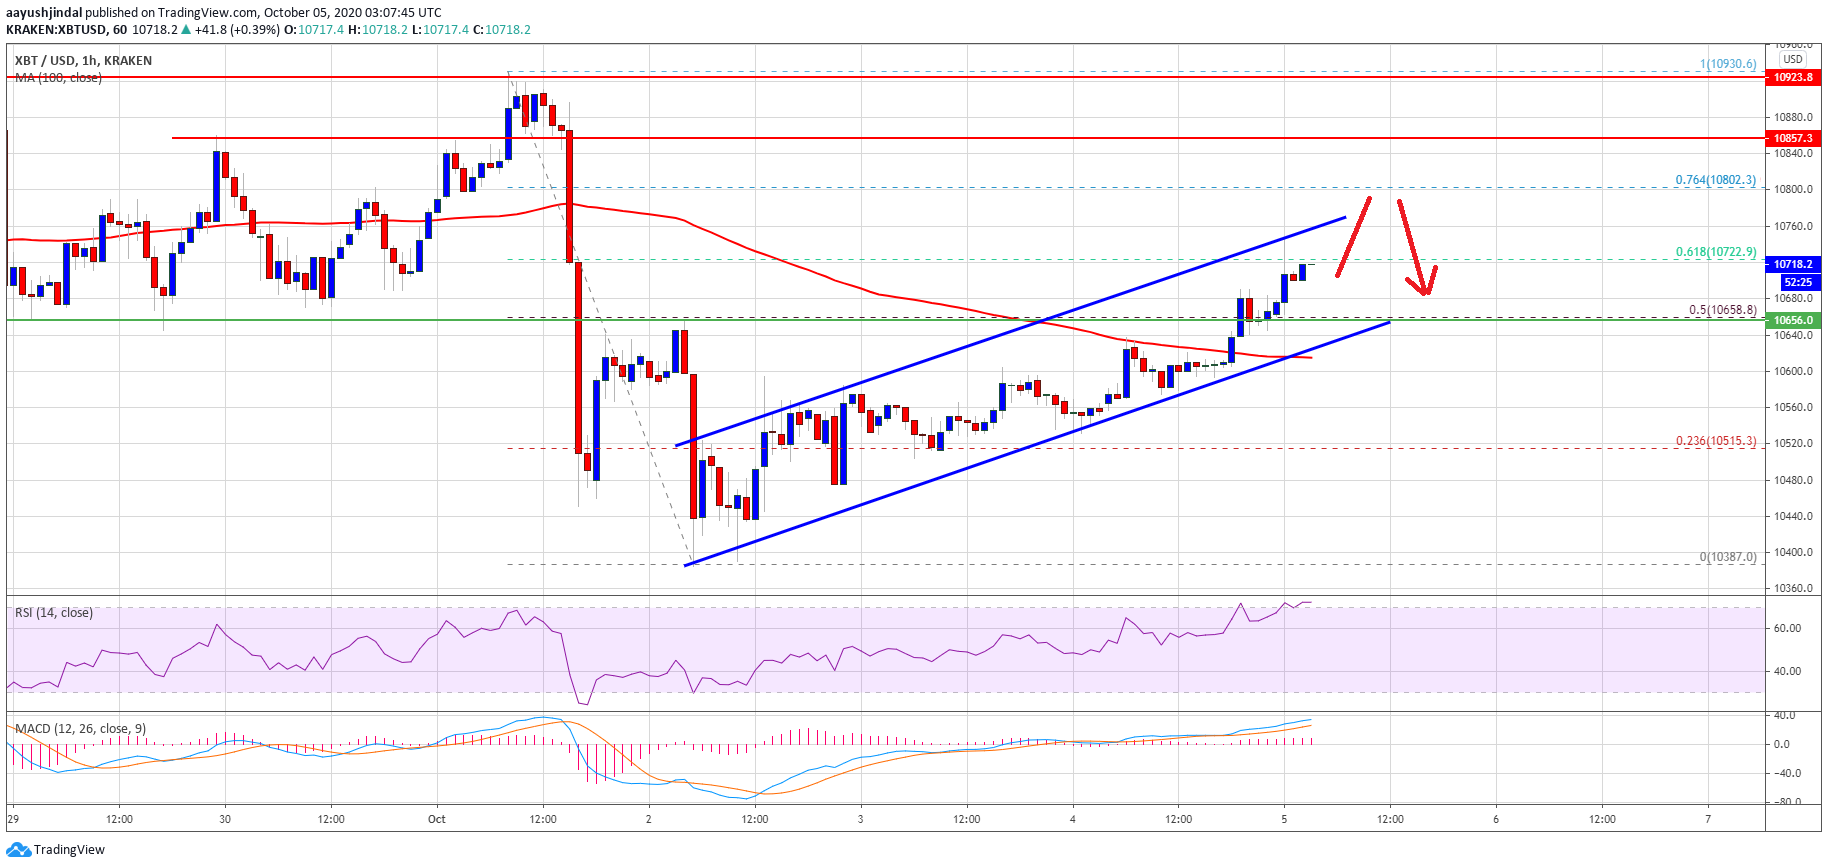
Bitcoin price is slowly recovering from the $10,387 low against the US Dollar. BTC broke the $10,650 resistance and it might soon test the $10,800 resistance or the $10,900 barrier.
- Bitcoin started a fresh upward move above the $10,550 and $10,650 resistance levels.
- The price is up 2%, and it is trading above the $10,700 level and the 100 hourly simple moving average.
- There is a key rising channel forming with support near $10,650 on the hourly chart of the BTC/USD pair (data feed from Kraken).
- The pair is currently showing positive signs, but it is likely to face strong resistance near $10,900.
Bitcoin Price is Facing Hurdles
After a steady decline, bitcoin price found support just above $10,350 against the US Dollar. BTC price traded as low as $10,387 and recently started a fresh upward move.
The bears seem to have lost control, as the price was able to climb above the $10,550 resistance level. There was also a break above the 50% Fib retracement level of the key decline from the $10,930 high to $10,387 low.
Bitcoin is now trading above the $10,650 resistance and the 100 hourly simple moving average. It seems like there is a key rising channel forming with support near $10,650 on the hourly chart of the BTC/USD pair.
Bitcoin price dives below $10,800. Source: TradingView.com
On the upside, the first major resistance is near the $10,800 level. It is close to the 76.4% Fib retracement level of the key decline from the $10,930 high to $10,387 low. The next major resistance is near the $10,850 level, above which the price might attempt another upside break above the $10,900 and $11,000 resistance levels.
A successful close above $10,900 and then a follow up move above $11,000 could start a strong increase in bitcoin in the coming sessions.
Fresh Drop in BTC?
If bitcoin fails to continue higher above the $10,800 resistance or the $10,900 barrier, there is a risk of a fresh drop. An initial support is near the channel lower trend line at $10,650.
The next major support is near the $10,600 level or the 100 hourly simple moving average, below which there are high chances of a fresh dive towards the $10,350 support zone.
Technical indicators:
Hourly MACD – The MACD is showing a few signs of recovery in the bullish zone.
Hourly RSI (Relative Strength Index) – The RSI for BTC/USD is currently well above the 60 level.
Major Support Levels – $10,650, followed by $10,600.
Major Resistance Levels – $10,800, $10,850 and $10,900.


