Reason to trust
How Our News is Made
Strict editorial policy that focuses on accuracy, relevance, and impartiality
Ad discliamer
Morbi pretium leo et nisl aliquam mollis. Quisque arcu lorem, ultricies quis pellentesque nec, ullamcorper eu odio.
Bitcoin failed to surpass the $11,000 resistance and started a fresh decline against the US Dollar. BTC is now well below the 100 SMA (H4) and it could decline further towards $10,000.
- Bitcoin failed once again to clear the $10,950 and $11,000 resistance levels.
- The price is now trading well below $10,750 and the 100 simple moving average (4-hours).
- There is a key connecting bullish trend line forming with support near $10,330 on the 4-hours chart of the BTC/USD pair (data feed from Kraken).
- The pair could correct higher, but upsides are likely to remain capped below $10,800 and the 100 SMA (H4).
Bitcoin Turns Red
This past week, bitcoin made another attempt to surpass the $10,950 and $11,000 resistance levels against the US Dollar. However, the bulls failed to gain strength, resulting in a sharp decline from the $10,940 swing high.
The price broke many important supports near $10,800 and $10,750 to move into a short-term bearish zone. There was also a break below the 50% Fib retracement level of the upward move from the $10,138 swing low to $10,950 high.
Bitcoin is now trading well below $10,750 and the 100 simple moving average (4-hours). The first major support on the downside is near the $10,350 zone. There is also a key connecting bullish trend line forming with support near $10,330 on the 4-hours chart of the BTC/USD pair.
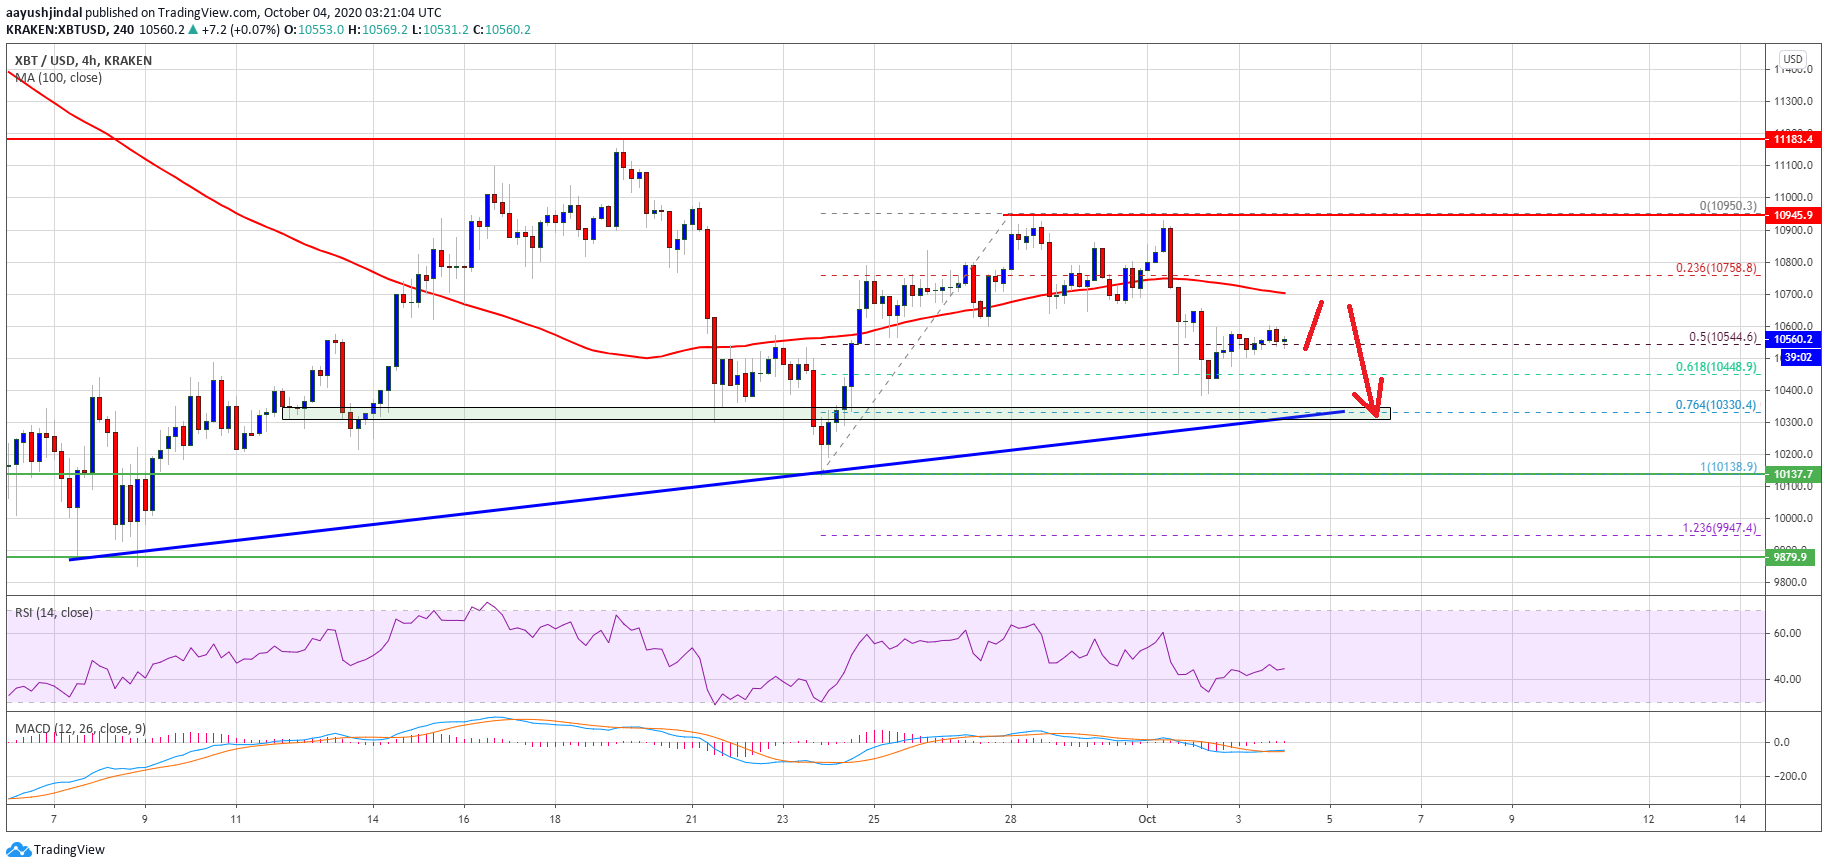
Bitcoin price dives below $10,800. Source: TradingView.com
The trend line is close to the 76.4% Fib retracement level of the upward move from the $10,138 swing low to $10,950 high. If there is a downside break below the trend line support and $10,300, there is a risk of more losses.
The next major support is near the $10,130 level, below which the bears might even aim a larger decline below the $10,000 support level in the near term.
Upsides to be Capped in BTC?
If bitcoin starts an upside correction, it could face sellers near $10,700. The first major resistance is still near the $10,800 level and the 100 simple moving average (4-hours).
The main resistance is still near the $10,950 and $11,000 levels. A close above the $11,000 resistance is must for a sustained upward move in the coming days.
Technical indicators
4 hours MACD – The MACD for BTC/USD is showing negative signs in the bullish zone.
4 hours RSI (Relative Strength Index) – The RSI for BTC/USD is now below the 50 level.
Major Support Level – $10,350
Major Resistance Level – $10,800