Reason to trust
How Our News is Made
Strict editorial policy that focuses on accuracy, relevance, and impartiality
Ad discliamer
Morbi pretium leo et nisl aliquam mollis. Quisque arcu lorem, ultricies quis pellentesque nec, ullamcorper eu odio.
Ripple failed to clear the $0.2450 resistance and declined sharply against the US Dollar. XRP price is now trading below the $0.2380 support and remains at a risk of a drop to $0.2200.
- Ripple is down more than 4% and it failed to clear the main $0.2450 resistance against the US dollar.
- The price is now trading well below $0.2380 and the 100 simple moving average (4-hours).
- Yesterday’s followed important bearish trend line is active with resistance near $0.2445 on the 4-hours chart of the XRP/USD pair (data source from Kraken).
- The pair is likely to accelerate lower towards $0.2200 if it breaks the $0.2280 support.
Ripple Price Resumes Decline
In the past two sessions, there was an increase in selling in bitcoin, Ethereum, and ripple. XRP price failed to clear the main $0.2450 resistance area (as discussed yesterday), and started a fresh decline.
There was a sharp decline below the $0.2400 level and the 100 simple moving average (4-hours). There was also a break below the 50% Fib retracement level of the key upward move from the $0.2195 swing low to $0.2550 swing high.
The decline was such that the bears pushed the price below the key $0.2380 support. More importantly, yesterday’s followed important bearish trend line is active with resistance near $0.2445 on the 4-hours chart of the XRP/USD pair.
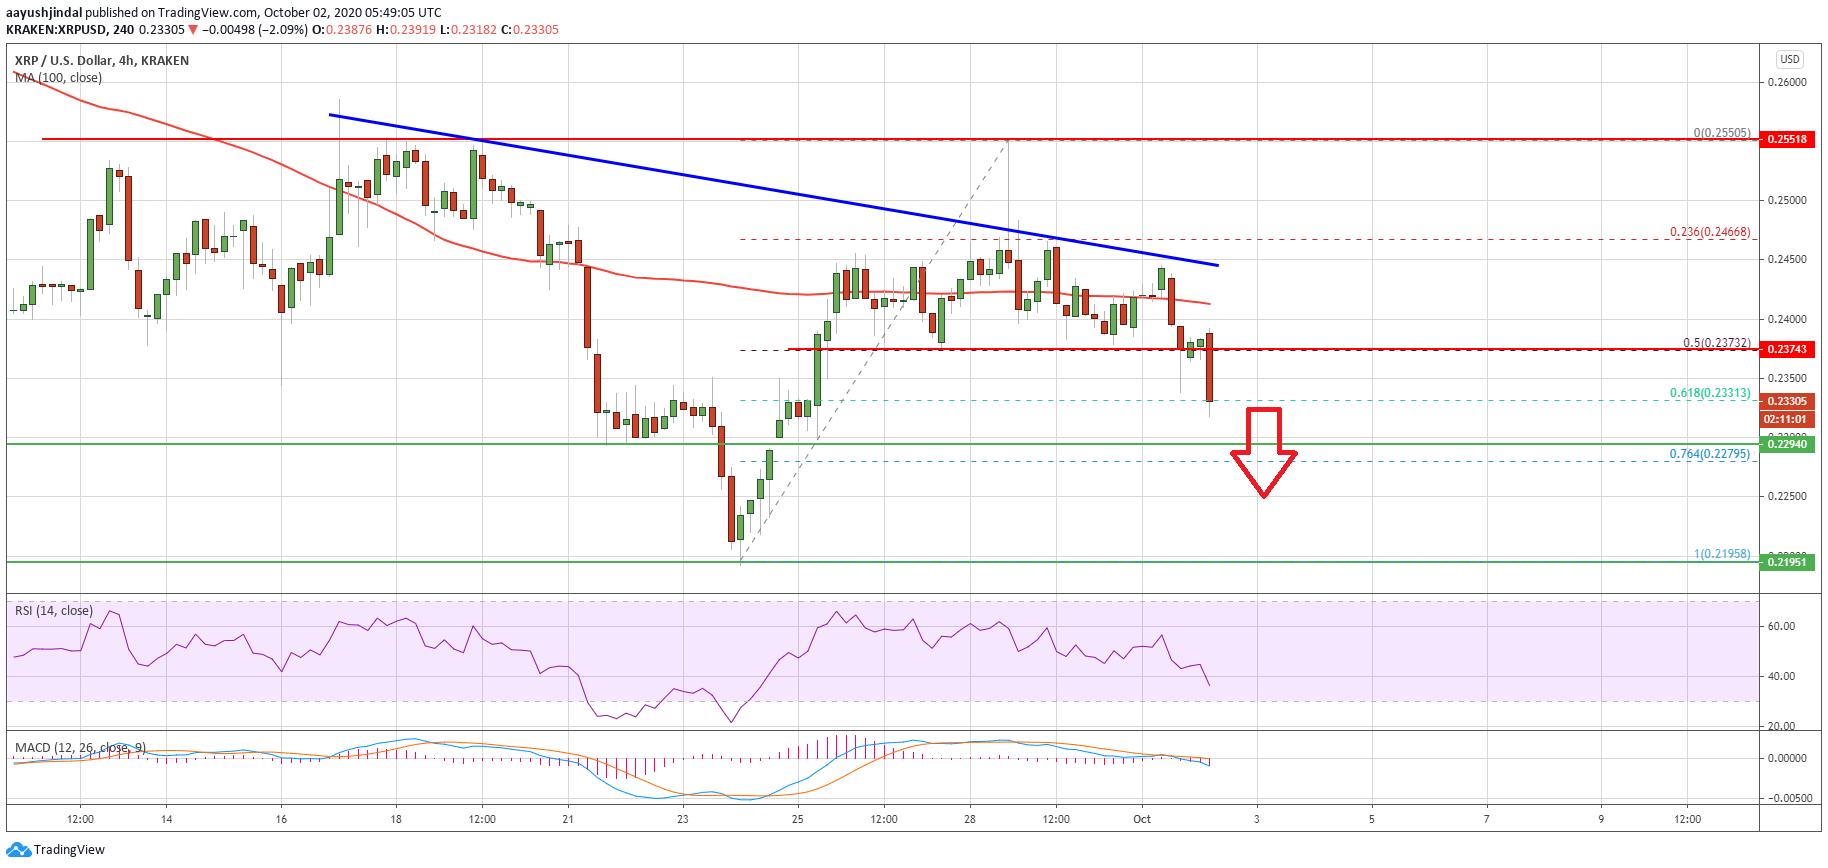
Ripple (XRP) price dives below $0.2380. Source: TradingView.com
The pair is now testing the $0.2300 zone, plus the 61.8% Fib retracement level of the key upward move from the $0.2195 swing low to $0.2550 swing high. If there is a downside break below the $0.2300 and $0.2280 support levels, it could open the doors for a sharp dip towards the next major support near the $0.2200 level. Any further losses could lead ripple towards the $0.2150 level.
Upsides Capped in XRP?
If ripple finds support near $0.2300 or $0.2280, there are chances of a short-term upside correction. On the upside, the price is likely to face a strong resistance near $0.2400 and the 100 simple moving average (4-hours).
The main resistance is still near the trend line and $0.2450, above which the bulls are likely to gain strength in the coming days.
Technical Indicators
4-Hours MACD – The MACD for XRP/USD is now gaining pace in the bearish zone.
4-Hours RSI (Relative Strength Index) – The RSI for XRP/USD is now well below the 50 level, with bearish signs.
Major Support Levels – $0.2300, $0.2280 and $0.2200.
Major Resistance Levels – $0.2380, $0.2400 and $0.2450.