
Reason to trust
How Our News is Made
Strict editorial policy that focuses on accuracy, relevance, and impartiality
Ad discliamer
Morbi pretium leo et nisl aliquam mollis. Quisque arcu lorem, ultricies quis pellentesque nec, ullamcorper eu odio.
Chainlink (LINK) started a strong upward move from the $7.32 low against the US Dollar. The bulls are now facing a strong resistance near $10.50, $11.00, and the 100 SMA (H4).
- Chainlink token price gained nicely above the $8.50 and $9.00 resistance levels against the US dollar.
- The price is now facing hurdles near the $10.50 resistance and the 100 simple moving average (4-hours).
- There is a key bullish flag forming with resistance near $10.45 on the 4-hours chart of the LINK/USD pair (data source from Kraken).
- The pair could either rally above $11.00 or it might trim all gains to drop back at $7.50.
Chainlink (LINK) is Facing Hurdles
This past week, we saw a sharp rise in chainlink (LINK) above the $8.50 and $9.00 resistance levels against the US Dollar. The price remained well bid after it settled above the $9.00 pivot level.
There was also a break above the 50% Fib retracement level of the key decline from the $13.30 swing high to $7.32 low. However, LINK price ran into a significant resistance at $11.00 and the 100 simple moving average (4-hours).
It seems like price is struggling to clear the last breakdown zone at $10.50 and $11.00. The 61.8% Fib retracement level of the key decline from the $13.30 swing high to $7.32 low is also acting as a strong resistance for the bulls.
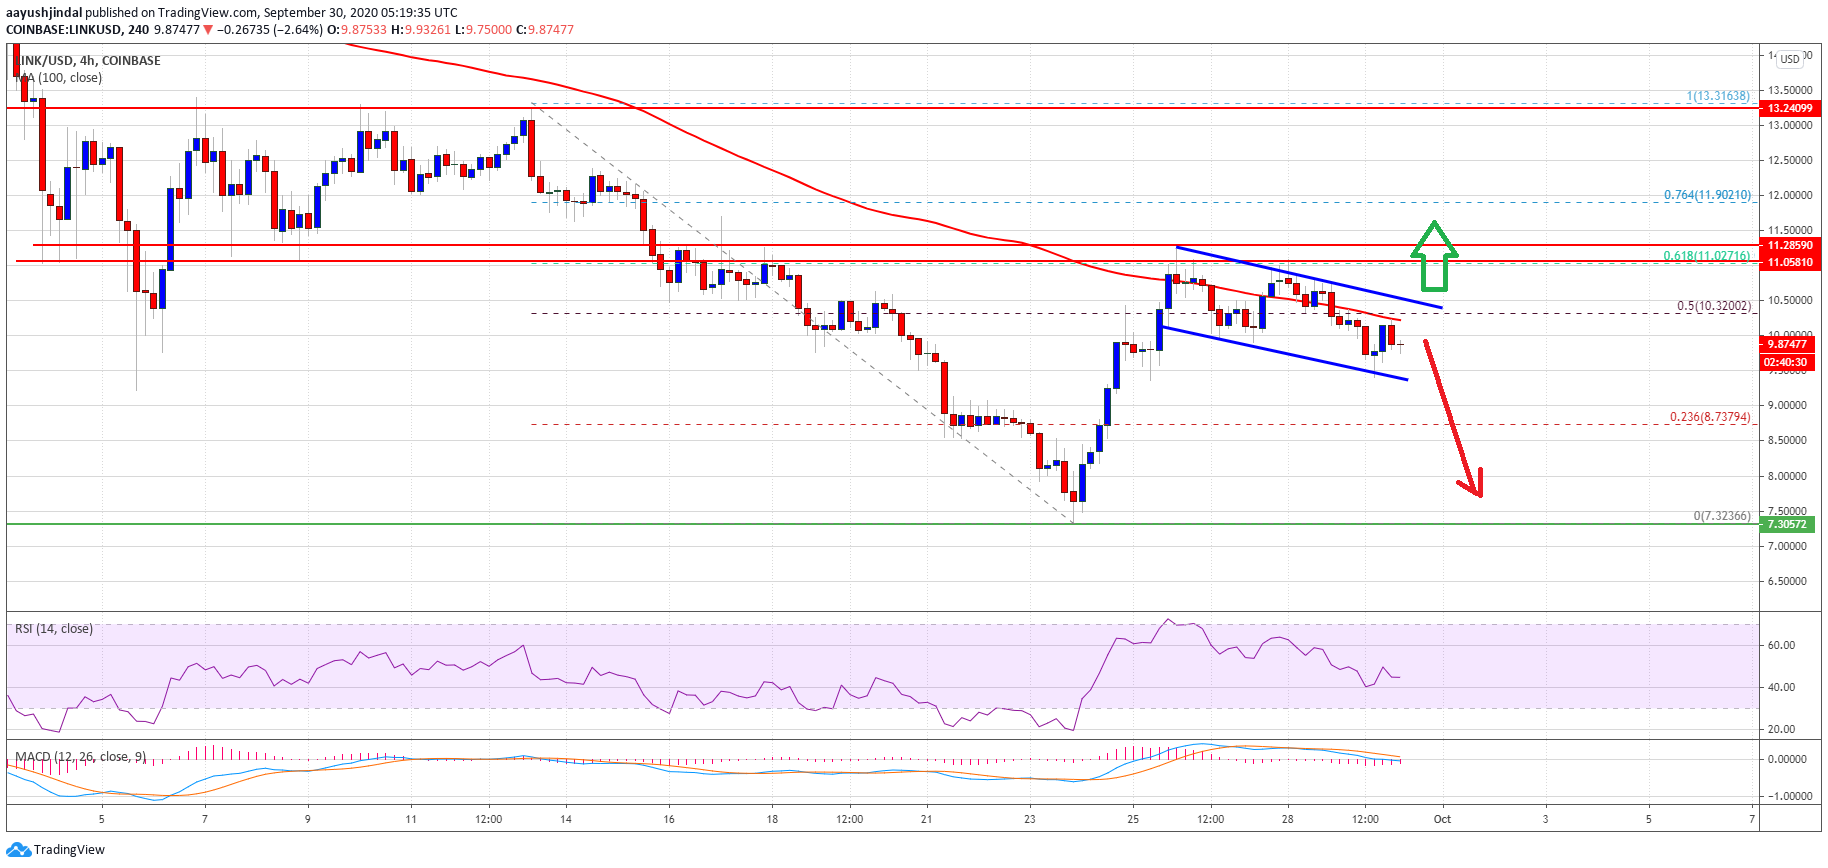
LINK price trades below $10.00. Source: TradingView.com
The price is currently correcting lower (similar to bitcoin and ethereum) and trading below $10.00. There is a key bullish flag forming with resistance near $10.45 on the 4-hours chart of the LINK/USD pair.
If there is an upside break above the channel resistance and $10.50, there are high chances of a sharp increase above the $11.00 resistance zone. In the stated case, the price could rally towards the $12.50 and $13.20 resistance levels.
Fresh Decline?
If chainlink’s price fails to clear the $10.50 resistance and stays below the 100 simple moving average (4-hours), there is a risk of a sharp decline.
An initial support on the downside is near the channel lower trend line at $9.40 level. The main support is near the $9.00 level, below which there are real chances of a drop towards the $7.50 level in the near term.
Technical Indicators
4-hours MACD – The MACD for LINK/USD is now gaining pace in the bearish zone.
4-hours RSI (Relative Strength Index) – The RSI for LINK/USD is now well below the 50 level.
Major Support Levels – $9.40, $9.00 and $8.50.
Major Resistance Levels – $10.40, $10.50 and $11.00.


