
Reason to trust
How Our News is Made
Strict editorial policy that focuses on accuracy, relevance, and impartiality
Ad discliamer
Morbi pretium leo et nisl aliquam mollis. Quisque arcu lorem, ultricies quis pellentesque nec, ullamcorper eu odio.
Bitcoin price is rising steadily above the $10,800 resistance against the US Dollar. However, BTC might face a strong resistance near the $11,000 and $11,100 levels in the near term.
- Bitcoin started a decent recovery wave above the $10,550 and $10,650 resistance levels.
- The price is now trading above the $10,800 resistance and the 100 hourly simple moving average.
- There was a break above a declining channel with resistance near $10,750 on the hourly chart of the BTC/USD pair (data feed from Kraken).
- The pair is likely to face a strong resistance near the $11,000 region.
Bitcoin Price is Rising Steadily
After a close above the $10,550 resistance, bitcoin price started following a positive path against the US Dollar. BTC even cleared the $10,650 and $10,700 levels to continue higher.
The price gained pace and cleared the $10,800 resistance. During the recent increase, there was a break above a declining channel with resistance near $10,750 on the hourly chart of the BTC/USD pair. It traded to a new weekly high at $10,945 and settled well above the 100 hourly simple moving average.
Bitcoin price is currently correcting lower and trading near $10,900. An initial support is near the $10,860 level or the 23.6% Fib retracement level of the recent rise from the $10,608 low to $10,945 high.
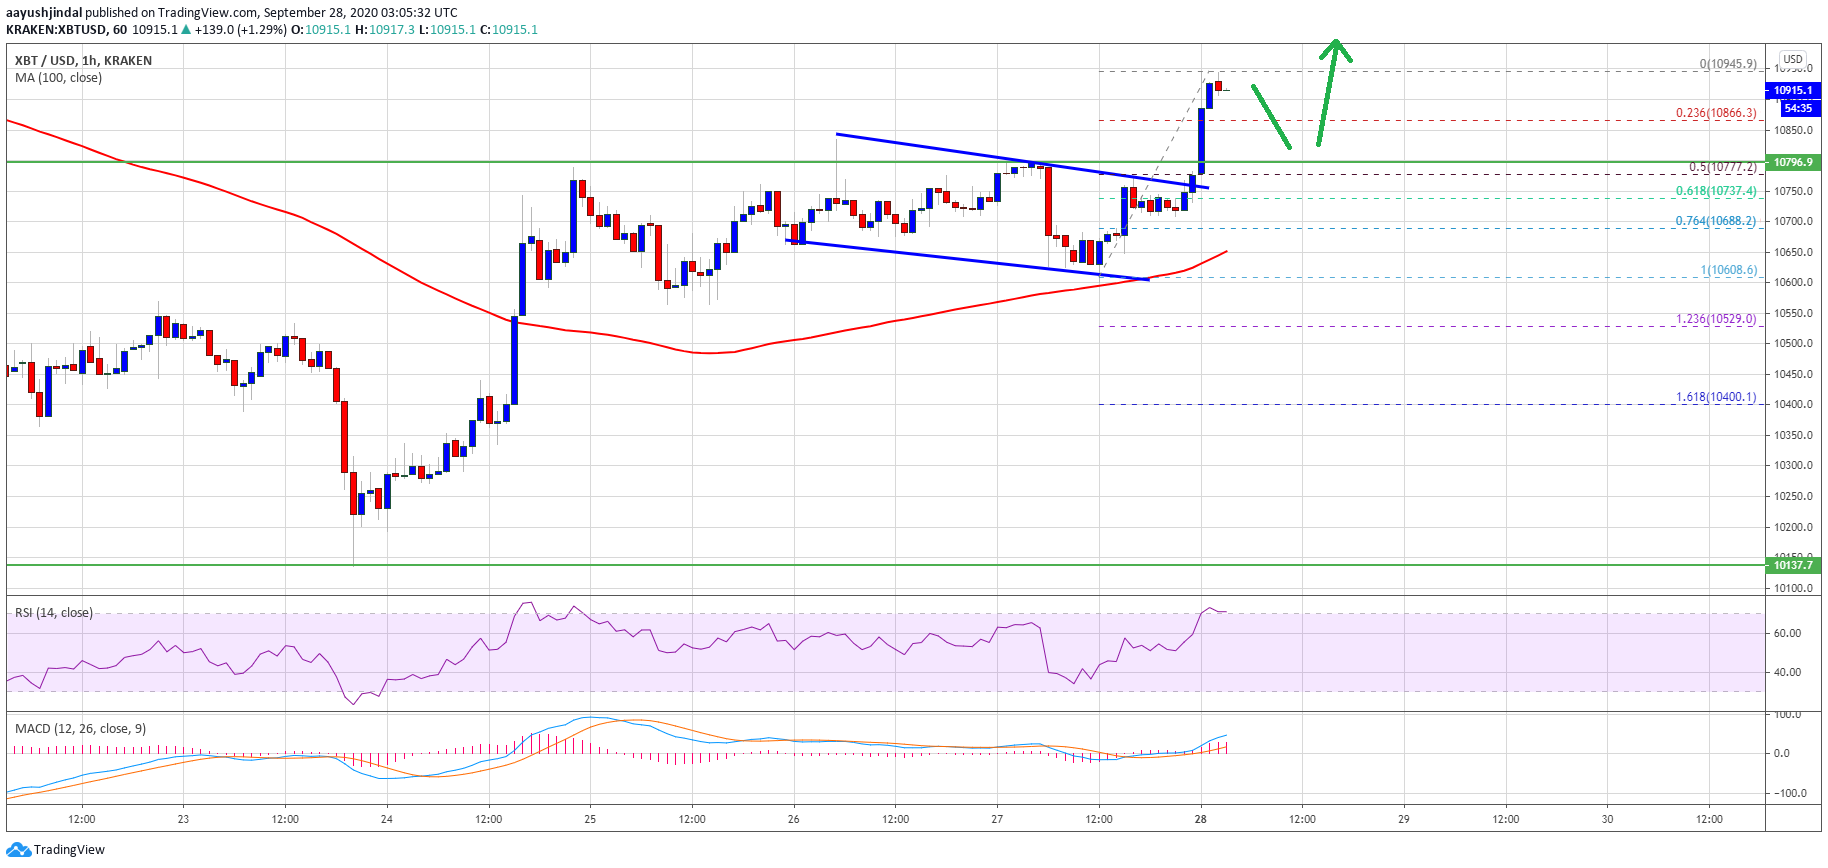
Bitcoin price surpasses $10,800. Source: TradingView.com
The first major support is near the $10,800 and $10,775 levels (the recent breakout zone and previous resistance). It is close to the 50% Fib retracement level of the recent rise from the $10,608 low to $10,945 high.
On the upside, the first major hurdle for the bulls is near the $11,000. A successful close above the $11,000 barrier could lead the price towards the next breakout zone at $11,200.
Downsides Could Be Limited in BTC
If bitcoin fails to continue higher above $10,950 and $11,000, it could start a downside correction. The first major support is seen near the $10,800 level.
The main support is now forming near the $10,650 level and the 100 hourly SMA, below which there is a risk of more downsides towards the $10,200 support in the near term.
Technical indicators:
Hourly MACD – The MACD is now gaining pace in the bullish zone.
Hourly RSI (Relative Strength Index) – The RSI for BTC/USD is correcting lower and it is above the 60 level.
Major Support Levels – $10,800, followed by $10,650.
Major Resistance Levels – $10,950, $11,000 and $11,200.