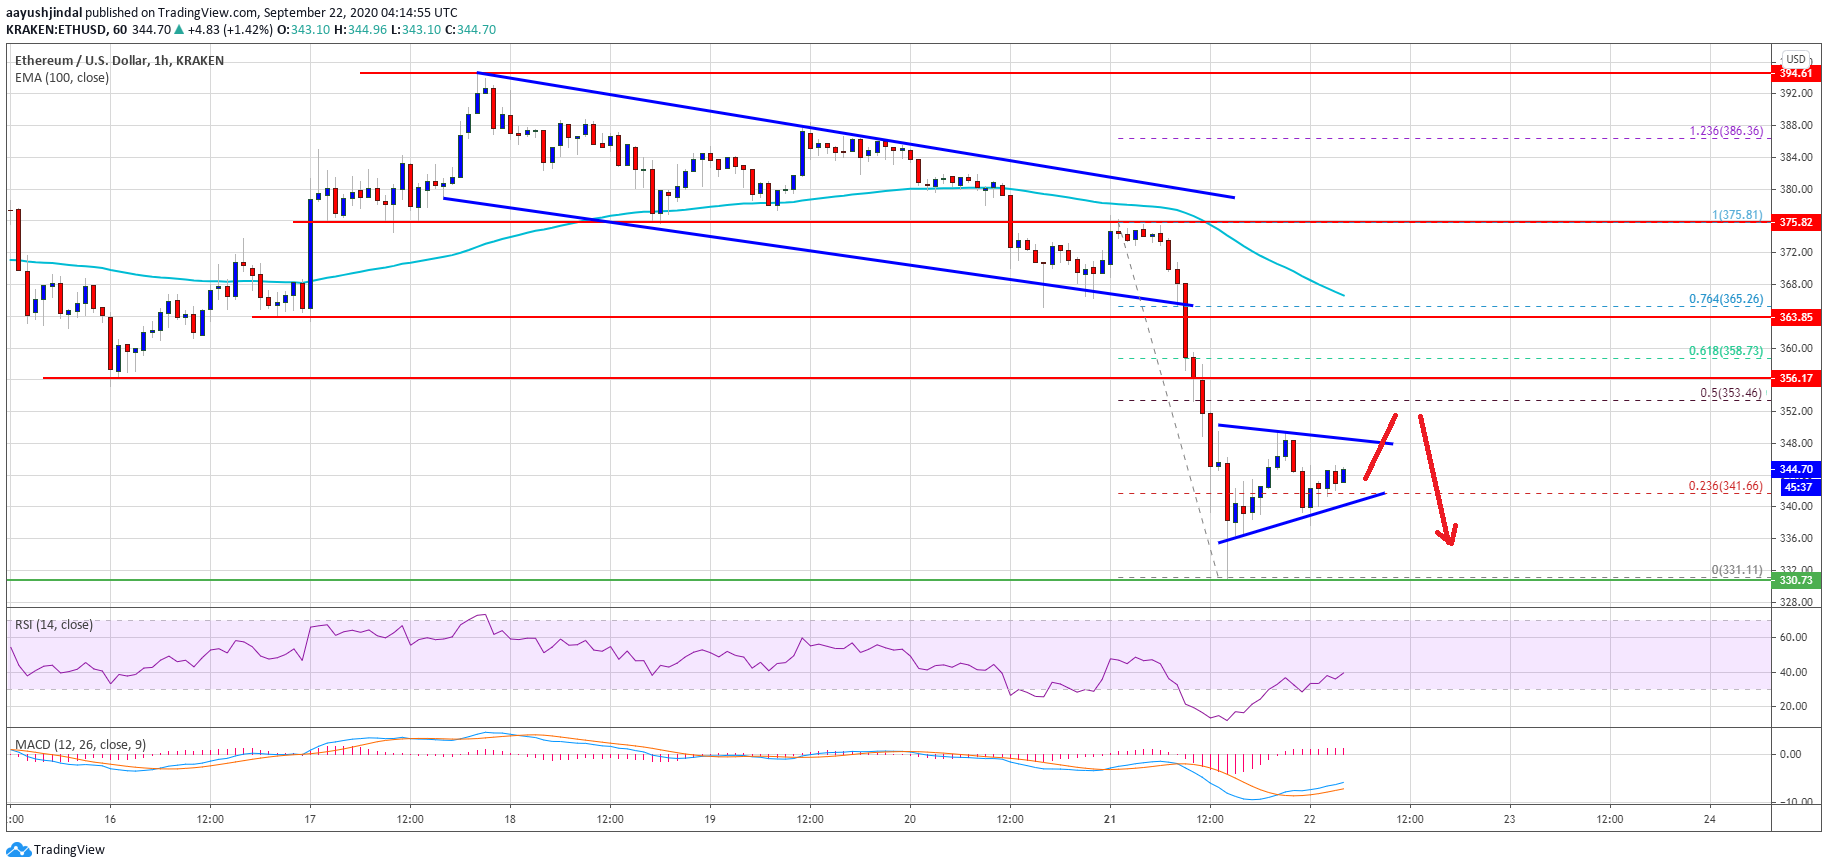
Ethereum is down over 8% and it broke many key supports near $355 against the US Dollar. ETH price is currently consolidating losses and it is likely to face hurdles near $355 or $362.
- Ethereum started a sharp decline from the $375 resistance and broke the $355 support.
- The price is finding bids above $330, but it is now well below the 100 hourly simple moving average.
- There is a short-term breakout pattern forming with resistance near $348 on the hourly chart of ETH/USD (data feed via Kraken).
- The pair is likely to face a strong resistance near the $355 zone (support turned resistance).
Ethereum Price Turns Red
Yesterday, we discussed the chances of a fresh decline in Ethereum if it fails to clear $375 and $380. ETH price struggled to clear the $375 resistance zone, resulting in a sharp bearish reaction.
The decline was initiated after there was a break below key declining channel with support at $365 on the hourly chart of ETH/USD. Ether price accelerated its decline below the main $355 support level and the 100 hourly simple moving average.
It is down over 8% and a new weekly low is formed near $331. Ethereum is currently correcting higher and trading above the $340 level. There was a break above the 23.6% Fib retracement level of the recent decline from the $375 high to $331 low.
Ethereum price dives below $355. Source: TradingView.com
It seems like there is a short-term breakout pattern forming with resistance near $348 on the same chart. If there is an upside correction above the $348 level, ether could face a strong selling interest near the $355 zone (support turned resistance).
The 50% Fib retracement level of the recent decline from the $375 high to $331 low is also near $353 to act as a resistance. The next major hurdle is seen near the $365 level or the 100 hourly SMA.
More Losses in ETH?
If Ethereum fails to recover above the triangle resistance of the $355 hurdle, there is a risk of more losses. An initial support is near the triangle support at $341.
A downside break below the triangle support could lead the price back towards the $330 swing low. The next major support for the bulls is near the $320 level, below which it could retest the $310 level.
Technical Indicators
Hourly MACD – The MACD for ETH/USD is slowly moving in the bullish zone.
Hourly RSI – The RSI for ETH/USD is correcting higher towards the 50 level.
Major Support Level – $330
Major Resistance Level – $355


