
Reason to trust
How Our News is Made
Strict editorial policy that focuses on accuracy, relevance, and impartiality
Ad discliamer
Morbi pretium leo et nisl aliquam mollis. Quisque arcu lorem, ultricies quis pellentesque nec, ullamcorper eu odio.
Bitcoin is showing positive signs above the $10,800 support against the US Dollar. BTC broke the $11,000 level and it is currently correcting lower towards key supports.
- Bitcoin gained pace and traded to a new weekly high at $11,176.
- The price is currently correcting below $11,000, but it is well above the 100 simple moving average (4-hours).
- There are two major bullish trend lines forming with support near $10,900 and $10,800 on the 4-hours chart of the BTC/USD pair (data feed from Kraken).
- The pair is likely to continue higher above $11,000 as long as there is no close below $10,800.
Bitcoin Turns Green
This past week, bitcoin started a steady rise above the $10,650 and $10,800 resistance levels against the US Dollar. BTC even broke the $11,000 level and settled well above 100 simple moving average (4-hours).
A new weekly high is formed near $11,176 and the price is currently correcting lower. There was a break below the $11,050 and $11,000 levels. Bitcoin even traded below the 50% Fib retracement level of the recent increase from the $10,818 low to $11,176 high.
On the downside, there are couple of important supports near the $10,800 level. There are also two major bullish trend lines forming with support near $10,900 and $10,800 on the 4-hours chart of the BTC/USD pair.
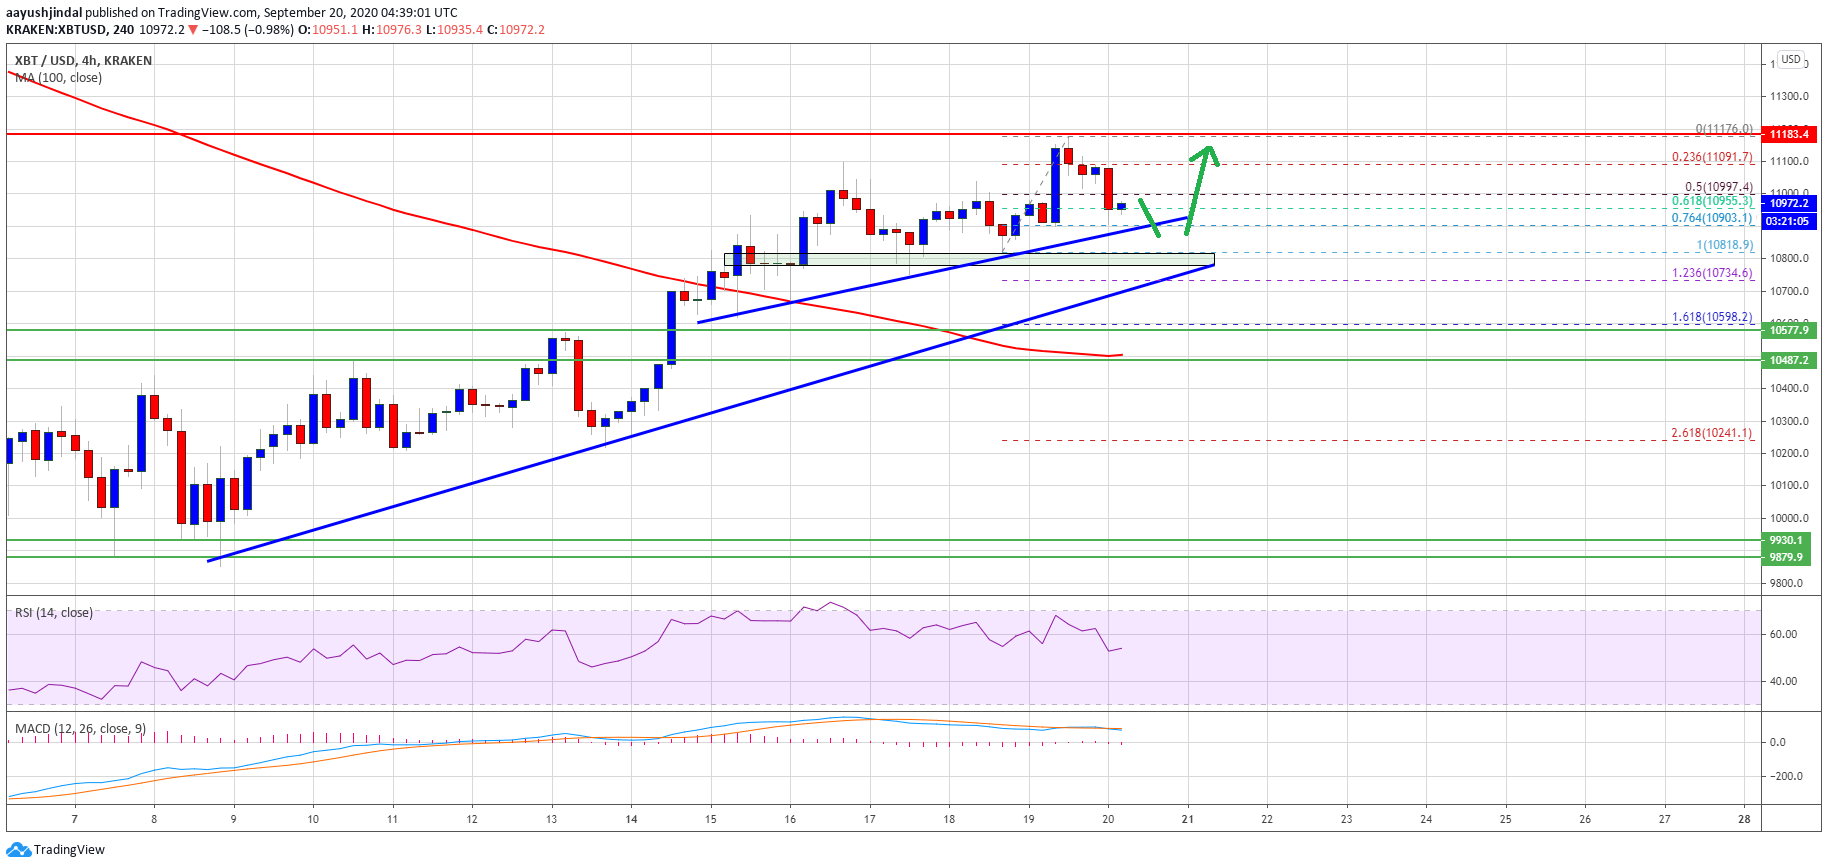
Bitcoin price breaks $11,000. Source: TradingView.com
The first trend line is close to the 76.4% Fib retracement level of the recent increase from the $10,818 low to $11,176 high. The second trend line is near the previous breakout zone at $10,800 (a strong support).
On the upside, the bulls are struggling to gain pace above $11,000 and $11,100. A successful close above the $11,200 level might clear the path for a push towards the $11,500 resistance or even $11,800.
Dips Supported in BTC?
If bitcoin struggles to climb above the $11,000 resistance, it might continue to move down. The main support on the downside is near the second trend line and $10,800.
A clear break and close below the $10,800 support level may perhaps lead the price towards the next major support near the $10,550 level. Any further losses might call for a test of the $10,200 level.
Technical indicators
4 hours MACD – The MACD for BTC/USD is slowly moving into the bearish zone.
4 hours RSI (Relative Strength Index) – The RSI for BTC/USD is still well above the 50 level.
Major Support Level – $10,800
Major Resistance Level – $11,200