
Reason to trust
How Our News is Made
Strict editorial policy that focuses on accuracy, relevance, and impartiality
Ad discliamer
Morbi pretium leo et nisl aliquam mollis. Quisque arcu lorem, ultricies quis pellentesque nec, ullamcorper eu odio.
Ripple is gaining pace above the $0.2500 resistance against the US Dollar. It seems like XRP is aiming a run towards the $0.2700 resistance level as long as it is above $0.2400.
- Ripple is showing positive signs above the $0.2450 and $0.2500 levels against the US dollar.
- The price traded to a new weekly high at $0.2580 and it settled above the 100 hourly simple moving average.
- There was a break above a major bearish trend line with resistance near $0.2460 on the hourly chart of the XRP/USD pair (data source from Kraken).
- The pair is correcting gains, but dips are likely to find bids near $0.2480 and $0.2450.
Ripple Price Showing Positive Signs
After forming a base above the $0.2400 level, ripple started an increase above the $0.2450 resistance. XRP price broke the $0.2480 resistance level and settled above the 100 hourly simple moving average.
To start the recent increase, there was a break above a major bearish trend line with resistance near $0.2460 on the hourly chart of the XRP/USD pair. The pair surged above the $0.2500 resistance level and traded to a new weekly high at $0.2580.
It is currently correcting lower and trading below the $0.2550 level. There was a break below the 23.6% Fib retracement level of the recent increase from the $0.2372 low to $0.2580 high.
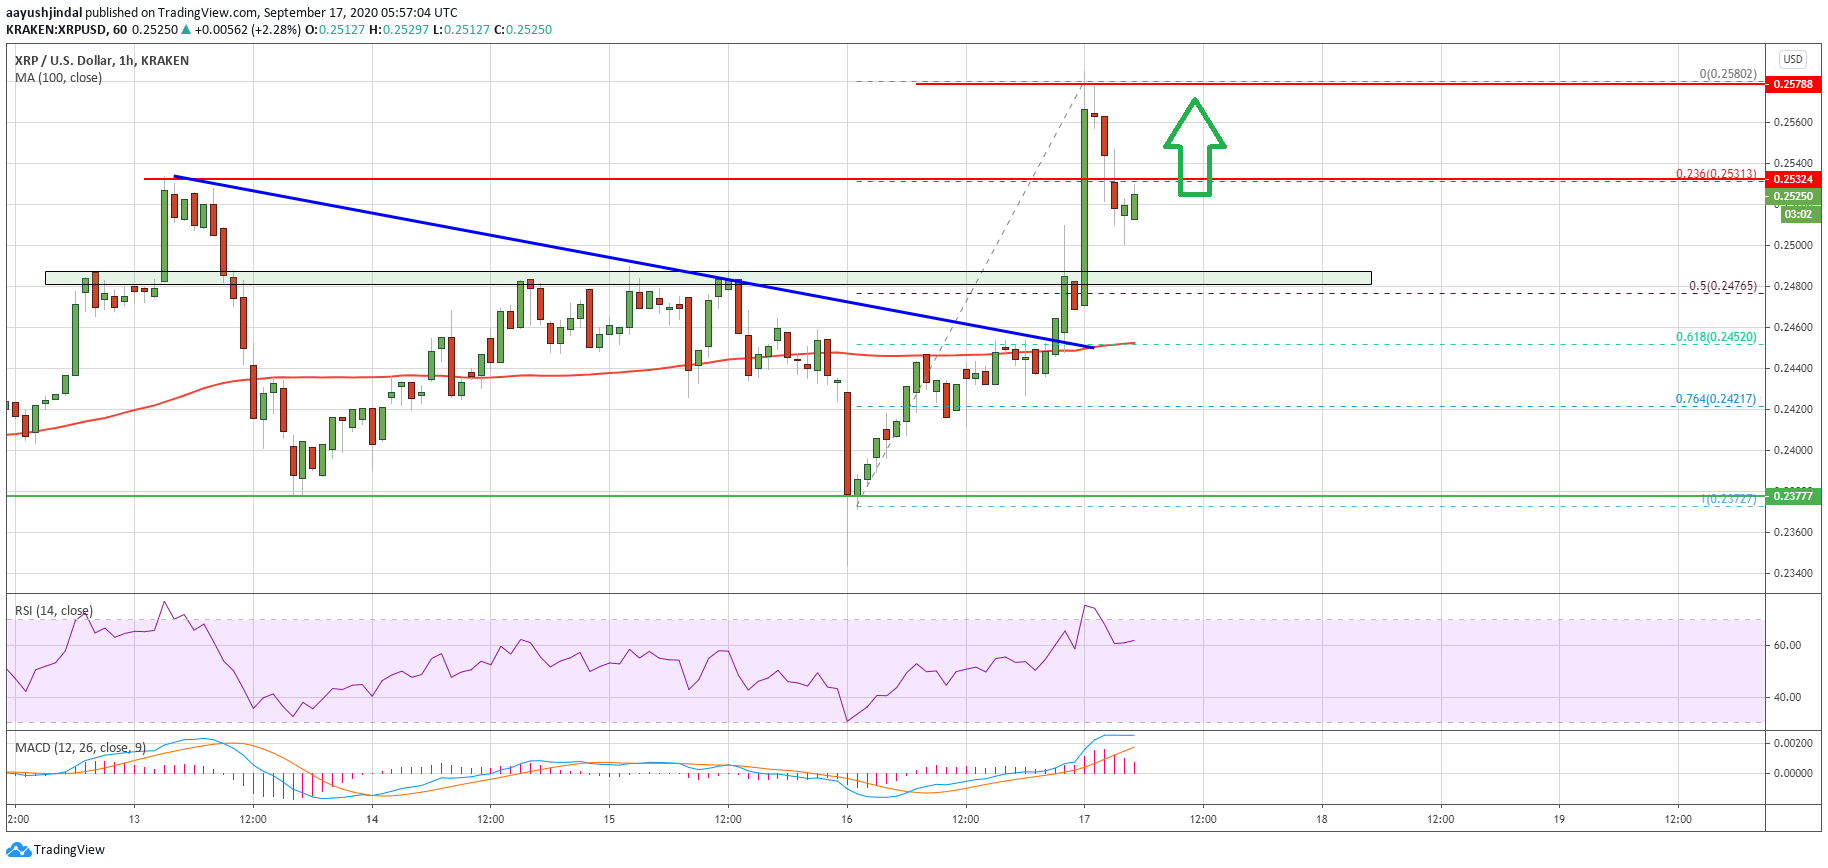
Ripple price trades above $0.2500. Source: TradingView.com
On the downside, there is a strong support forming near the $0.2475 level (the recent breakout zone). The 50% Fib retracement level of the recent increase from the $0.2372 low to $0.2580 high is also near the $0.2475 level to act as a support.
If ripple stays above the $0.2475 support, it is likely to resume its upside. An initial resistance is near the $0.2540 level. The first major resistance is near the $0.2580 level, above which the price might accelerate higher towards the $0.2620 resistance or even $0.2700.
Bearish Move in XRP?
If ripple fails to clear the $0.2540 and $0.2580 resistance levels, there could be a bearish reaction. An initial support on the downside is near the $0.2475 zone.
The main support is forming near the $0.2450 level, the broken trend line, and the 100 hourly simple moving average. A close below the $0.2450 support might lead the price towards the $0.2400 support.
Technical Indicators
Hourly MACD – The MACD for XRP/USD is now losing momentum in the bullish zone.
Hourly RSI (Relative Strength Index) – The RSI for XRP/USD is currently correcting lower and it is near the 60 level.
Major Support Levels – $0.2475, $0.2450 and $0.2440.
Major Resistance Levels – $0.2540, $0.2580 and $0.2620.


