
Reason to trust
How Our News is Made
Strict editorial policy that focuses on accuracy, relevance, and impartiality
Ad discliamer
Morbi pretium leo et nisl aliquam mollis. Quisque arcu lorem, ultricies quis pellentesque nec, ullamcorper eu odio.
Bitcoin price is slowly gaining momentum and it broke the $10,700 resistance against the US Dollar. BTC is up 5%, but it is still facing a major resistance near $10,800 and $11,000.
- Bitcoin is rising and it broke the $10,500 and $10,700 resistance levels.
- It is now trading well above the $10,580 pivot level and the 100 hourly simple moving average.
- There was a break above a key contracting triangle with resistance near $10,440 on the hourly chart of the BTC/USD pair (data feed from Kraken).
- The pair is still facing a crucial breakout resistance near $10,800 and $11,000.
Bitcoin Price is Gaining Traction
There was a steady rise in bitcoin price from the $10,200 support zone against the US Dollar. BTC broke the $10,500 resistance level to start the recent increase.
The bulls even pushed the price above the $10,580 pivot level and the price settled well above the 100 hourly simple moving average. The upward move gained pace after there was a break above a key contracting triangle with resistance near $10,440 on the hourly chart of the BTC/USD pair. The pair even broke $10,700 and spiked above $10,800.
Bitcoin price traded as high as $10,827 and it is currently showing a lot of positive signs. If there is a downside correction, the price might find support near $10,730 or the 50% Fib retracement level of the recent rise from the $10,633 swing low to $10,827 high.
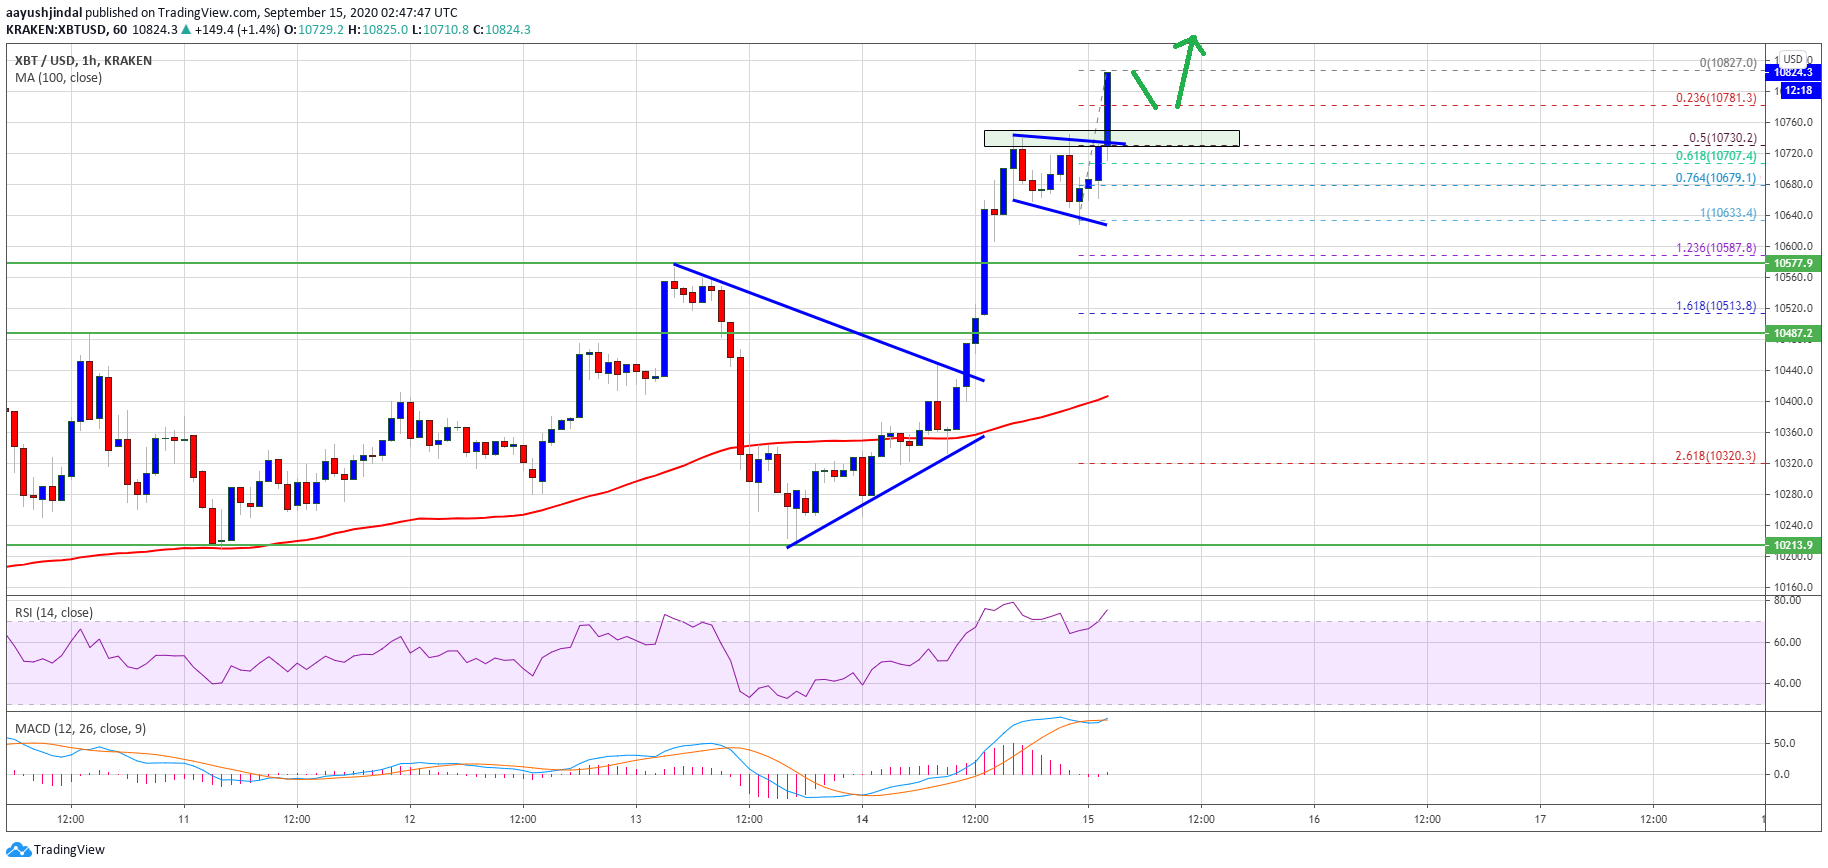
Bitcoin price trades above $10,700. Source: TradingView.com
On the upside, the bulls are likely to face a lot of hurdles near $10,800, $10,850 and $11,000 (as discussed in the weekly analysis). A successful close above the $11,000 resistance is needed for a sustained upward move.
Fresh Decline in BTC?
If bitcoin fails to clear the $10,800 resistance or the $11,000 barrier, there is a risk of a downside correction. An initial support is near the $10,730 level.
The first major support is near the $10,700 level or the 61.8% Fib retracement level of the recent rise from the $10,633 swing low to $10,827 high. Any further losses could lead the price towards the $10,580 level (previous resistance now support), where the bulls are likely to take a stand.
Technical indicators:
Hourly MACD – The MACD is currently gaining pace in the bullish zone.
Hourly RSI (Relative Strength Index) – The RSI for BTC/USD is currently well above the 65 level.
Major Support Levels – $10,700, followed by $10,580.
Major Resistance Levels – $10,800, $10,850 and $11,000.