
Reason to trust
How Our News is Made
Strict editorial policy that focuses on accuracy, relevance, and impartiality
Ad discliamer
Morbi pretium leo et nisl aliquam mollis. Quisque arcu lorem, ultricies quis pellentesque nec, ullamcorper eu odio.
Bitcoin price started a decent recovery wave above the $10,200 resistance against the US Dollar. BTC is still struggling near $10,500, but dips are likely to remain supported near $10,200.
- Bitcoin is currently correcting lower from the $10,500 resistance zone.
- It is trading below the 100 hourly simple moving average and approaching the $10,200 support.
- There is a connecting bullish trend line forming with support near $10,240 on the hourly chart of the BTC/USD pair (data feed from Kraken).
- The pair is likely to find a strong buying interest near the $10,200 and $10,150 levels.
Bitcoin Price Approaching Key Supports
Yesterday, we saw a decent recovery wave in bitcoin price above the $10,200 resistance against the US Dollar. BTC even broke the 100 hourly simple moving average and spiked above the $10,400 resistance.
However, the bulls failed to gain strength and the price remained below the $10,500 resistance. A high is formed near $10,492 and the price is currently correcting lower. There was a break below the $10,350 and $10,300 levels.
Bitcoin is now trading below the 23.6% Fib retracement level of the recent recovery wave from the $9,855 swing low to $10,492 high. The first major support on the downside is near the $10,250 level. There is also a connecting bullish trend line forming with support near $10,240 on the hourly chart of the BTC/USD pair.
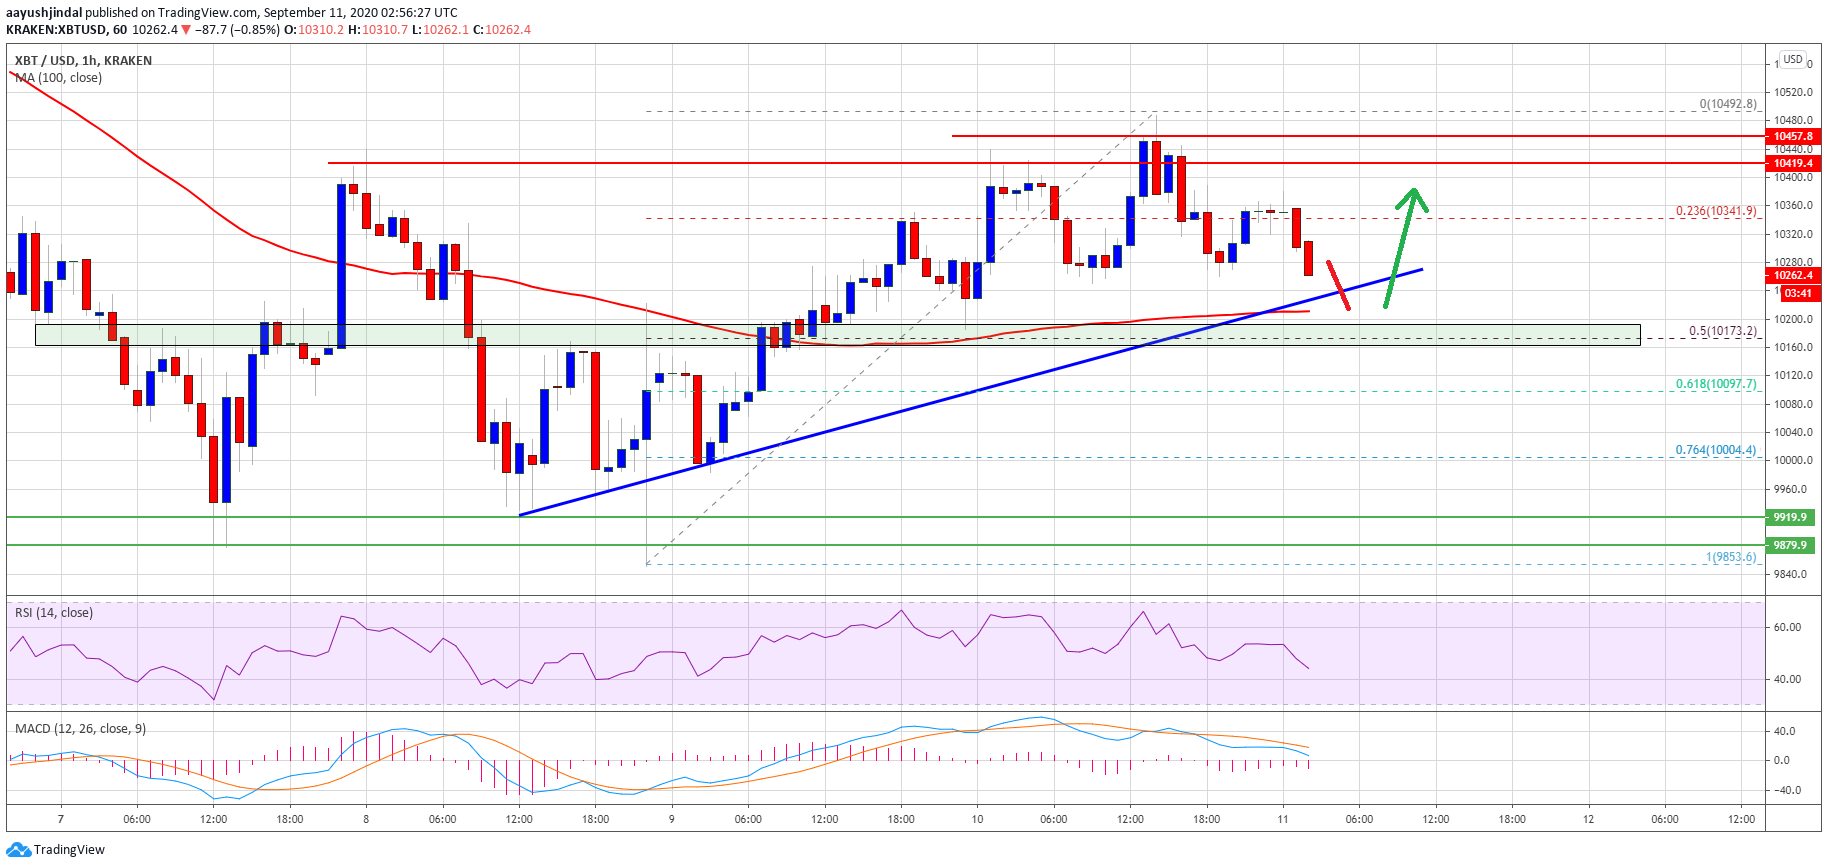
Bitcoin price trades below $10,400. Source: TradingView.com
The next major support is near the $10,200 level and the 100 hourly SMA. On the upside, the price is facing a strong resistance near the $10,400 and $10,500 levels.
A successful close above the $10,500 resistance level is must for upside continuation. The next major resistance is near $10,600, above which the price is likely to rise towards the key $11,000 hurdle.
More Losses in BTC?
If bitcoin fails to stay above the $10,200 support and the 100 hourly SMA, there is a risk of more losses. The next major support is near the $10,160 level (the previous breakout zone).
A close below the $10,160 and $10,150 levels may perhaps increase chances of another breakdown. In the stated case, the price could even revisit the $9,850 support level. A daily close below the $9,850 level is likely to push the price towards $9,500.
Technical indicators:
Hourly MACD – The MACD is slowly gaining pace in the bearish zone.
Hourly RSI (Relative Strength Index) – The RSI for BTC/USD is currently well below the 50 level.
Major Support Levels – $10,200, followed by $10,150.
Major Resistance Levels – $10,400, $10,500 and $10,600.