
Reason to trust
How Our News is Made
Strict editorial policy that focuses on accuracy, relevance, and impartiality
Ad discliamer
Morbi pretium leo et nisl aliquam mollis. Quisque arcu lorem, ultricies quis pellentesque nec, ullamcorper eu odio.
Ethereum is recovering higher and trading above the $335 resistance against the US Dollar. ETH price is likely to accelerate higher if it clears the $360 level and the 100 hourly SMA.
- Ethereum is slowly recovering above the $335 and $340 resistance levels.
- The price is still facing a major resistance near $360 and the 100 hourly simple moving average.
- There was a break above a major bearish trend line with resistance near $351 on the hourly chart of ETH/USD (data feed via Kraken).
- The pair could start a sharp relief rally if it clears the $360 resistance zone.
Ethereum Price Approaching Breakout Zone
After forming a strong support base above $310, Ethereum started a decent recovery. ETH price recovered above the $320 and $335 resistance levels to move into a short-term positive zone.
There was a break above the 50% Fib retracement level of the downward move from the $360 swing high to $323 swing low. More importantly, there was a break above a major bearish trend line with resistance near $351 on the hourly chart of ETH/USD.
Ether price is now consolidating above the broken trend line and $345. It seems like the price is stuck near the 76.4% Fib retracement level of the downward move from the $360 swing high to $323 swing low.
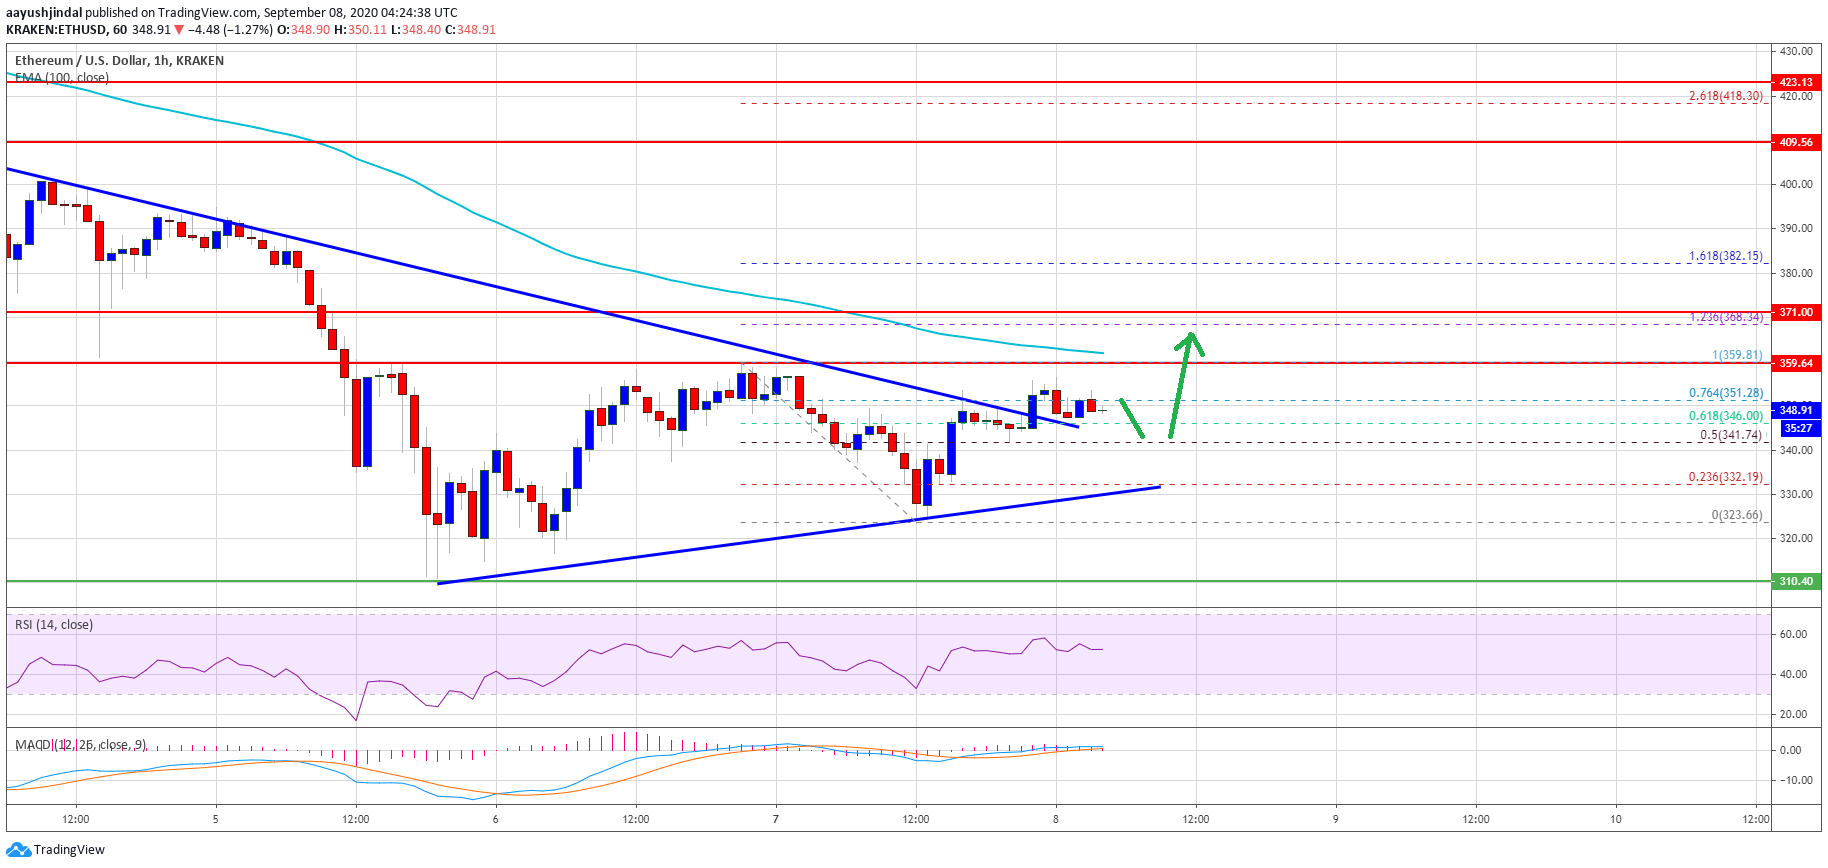
Ethereum price trades above $345. Source: TradingView.com
On the upside, there is a strong resistance forming near the $360 level and the 100 hourly simple moving average. A clear break and close above the 100 hourly SMA could lift the market sentiment and the price might climb above the $370 resistance.
The next stop for the bulls might be near the $385 level or the 1.236 Fib extension level of the downward move from the $360 swing high to $323 swing low. The main barrier is now forming near $400.
Fresh Drop in ETH?
If Ethereum fails to clear the $360 resistance and the 100 hourly SMA, there is a risk of a fresh decline. An initial support on the downside is near the $340 level.
The next major support is near the $332 level and a connecting bullish trend line on the same chart. A break below the trend line and $330 might push ether back towards the $310 support.
Technical Indicators
Hourly MACD – The MACD for ETH/USD is slowly gaining momentum in the bullish zone.
Hourly RSI – The RSI for ETH/USD is now above the 50 level.
Major Support Level – $332
Major Resistance Level – $360


