
Reason to trust
How Our News is Made
Strict editorial policy that focuses on accuracy, relevance, and impartiality
Ad discliamer
Morbi pretium leo et nisl aliquam mollis. Quisque arcu lorem, ultricies quis pellentesque nec, ullamcorper eu odio.
Chainlink (LINK) is up around 20% from the $9.20 swing low against the US Dollar. It broke the $12.00 resistance, but now facing a major resistance near the $13.50 level.
- Chainlink token price started a strong recovery wave from the $9.21 monthly low against the US dollar.
- It gained pace above the $12.00 resistance, but is still below the 100 simple moving average (4-hours).
- There is a crucial bearish trend line forming with resistance near $13.00 on the 4-hours chart of the LINK/USD pair (data source from Kraken).
- The pair must break $13.00 and $13.50 to continue higher in the near term.
Chainlink (LINK) Rally is Facing Hurdles
This past week, we saw a sharp decline in bitcoin, Ethereum, ripple, and chainlink (LINK) against the US Dollar. LINK broke many supports near $15.00 and the 100 simple moving average (4-hours) to move into a bearish zone.
The decline gained pace below the $13.50 and $12.50 support levels. It even broke the $10.00 level and traded to a new monthly low at $9.21. Recently, the bulls came into action and the price pumped above the $10.00 pivot level.
There was a break above the 23.6% Fib retracement level of the downward move from the $17.74 high to $9.21 low. Chainlink rallied 20% and it even broke the $13.00 level.
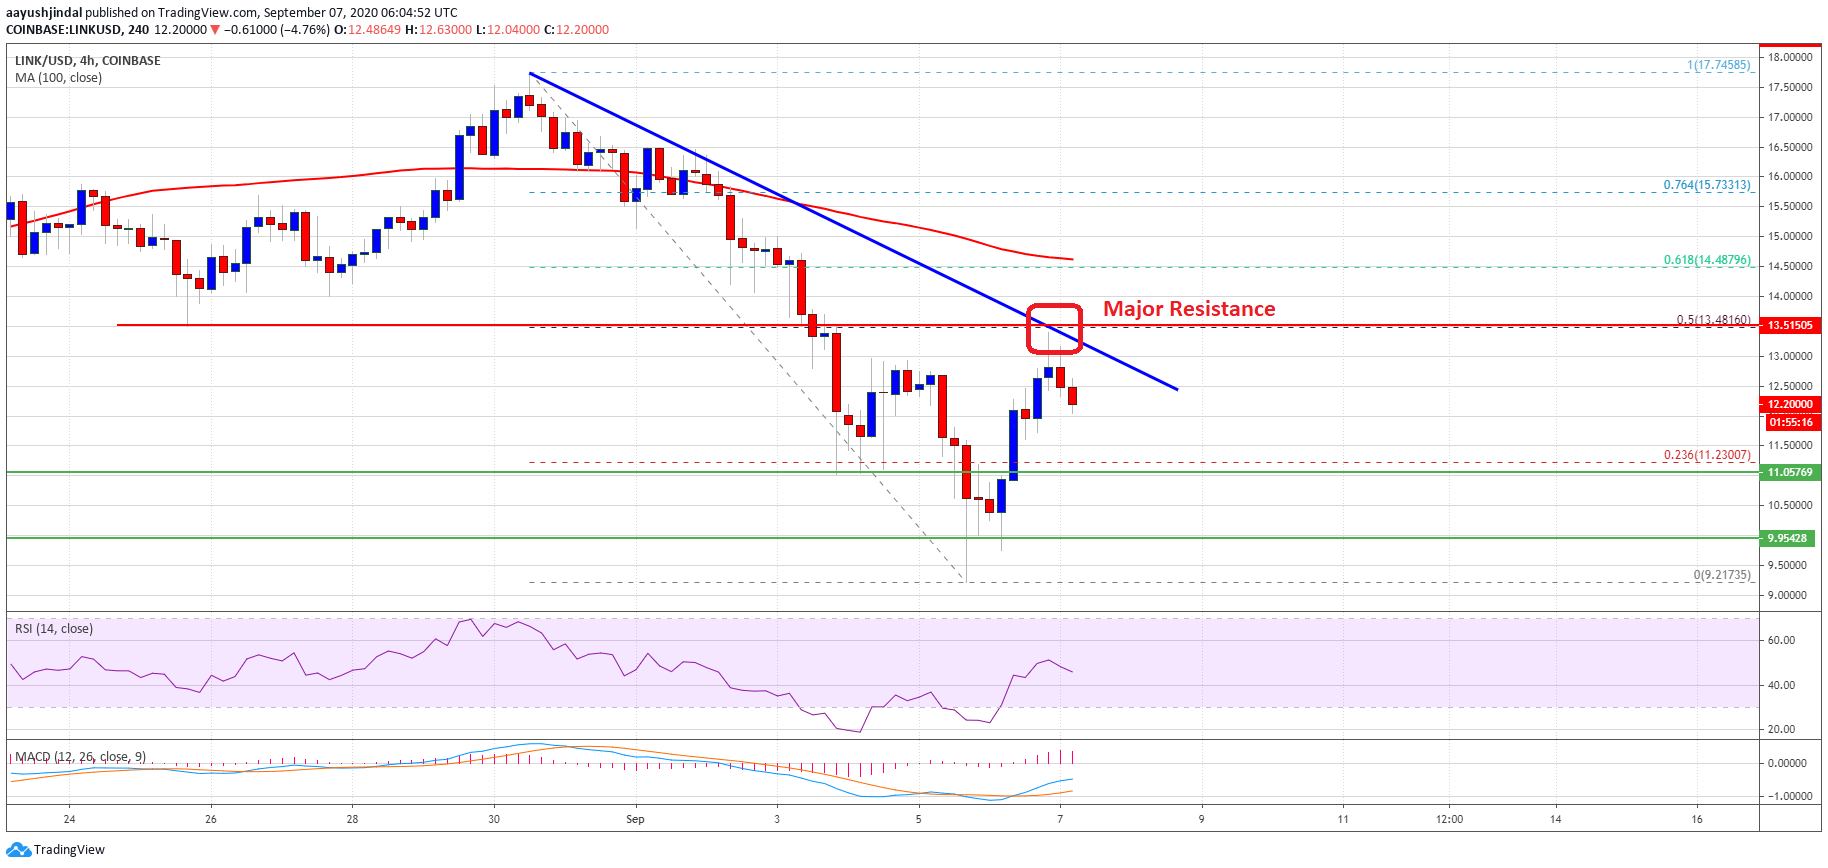
LINK price above $13.000. Source: TradingView.com
However, the price is now facing a major hurdle near the $13.00 and $13.50 levels. There is also a crucial bearish trend line forming with resistance near $13.00 on the 4-hours chart of the LINK/USD pair. The trend line coincides with the 50% Fib retracement level of the downward move from the $17.74 high to $9.21 low.
It seems like the bulls might struggle to clear the trend line and the $13.50 resistance. If they succeed, chainlink (LINK) might rise steadily towards the $15.50 and $15.50 levels in the near term.
Dips Likely to be Supported
On the downside, chainlink’s price is likely to find strong bids near the $11.50 and $11.20 levels. The next major support is near the $11.05 level.
A downside break below the $11.00 support level could push the price back into a negative zone. In the stated case, the price could continue to decline towards the $10.00 level.
Technical Indicators
4-hours MACD – The MACD for LINK/USD is slowly losing pace in the bullish zone.
4-hours RSI (Relative Strength Index) – The RSI for LINK/USD is still below the 50 level.
Major Support Levels – $11.50, $11.20 and $11.05.
Major Resistance Levels – $13.00, $13.20 and $13.50.