The dollar’s impact on markets in 2020 cannot be overstated. Its weakness and decline in the face of the pandemic and a dwindling US economy, has allowed assets like Bitcoin, precious metals, and equities to surge.
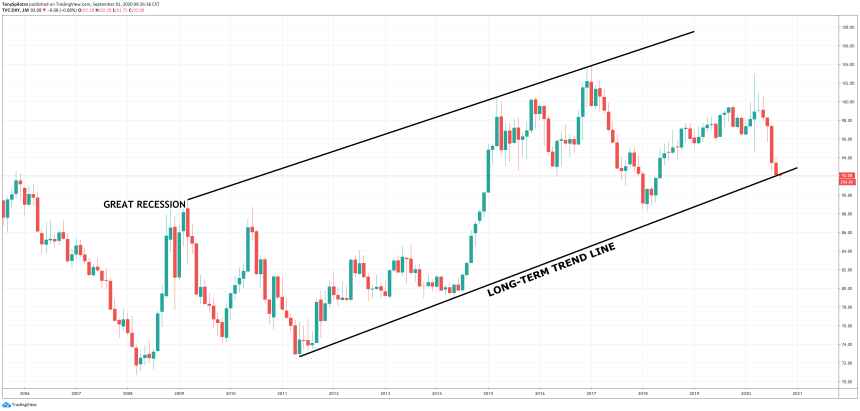
However, the DXY Dollar Currency Index just closed a monthly candle below an over decade-long trend line dating back to the United States’ exit from the Great Recession. And it could mean more downside ahead.
DXY Loses Trend Line Dating Back To Great Recession
All global financial markets are tied to the United States dollar in some way. As the global reserve currency and the primary asset that all exchange rates are set against, it can have a dramatic impact on all assets.
Related Reading | Why The Dollar’s Coming Dead Cat Bounce Could Be Devastating For Bitcoin
A mad dash into the dollar on Black Thursday is what prompted the catastrophic market collapse that took Bitcoin back down to $3,800 and crushed the stock market.
Since then, however, the dollar has been on a steady downtrend and nearly all other assets have revisited highs or set new records. Analysts are warning that the dollar’s debasement claims are over-exaggerated, and are expecting a bounce soon.

DXY Dollar Currency Index Monthly Trend Line | Source: TradingView
But the DXY Dollar Currency Index, a basket of top forex currencies weighted against USD, just closed a monthly candle below an over decade-long trend line that could suggest the fall of the almighty dollar has only just begun. If this is true, “Bitcoin, metals, and equities will fly.”

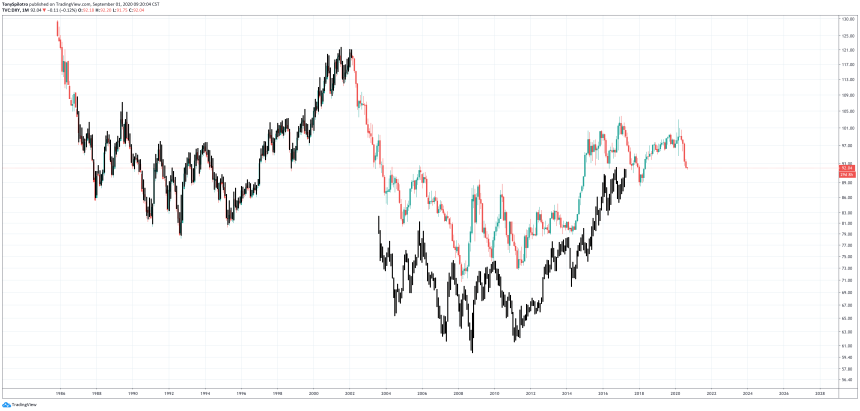
DXY Dollar Currency Index Bear Market Fractal | Source: TradingView
Bitcoin Could Rip Toward A New All-Time High If Dollar Bear Flag Confirms
As if losing the trend line wasn’t dangerous enough for the dollar’s reign, the greenback also appears to be following in an ominous fractal that hints at a much deeper crash and another bear market in the dollar.
Related Reading | What Does The Dollar’s Do Or Die Moment Say About Bitcoin?
A bear market in the dollar could mean a bull market in several other assets, including Bitcoin and cryptocurrencies.

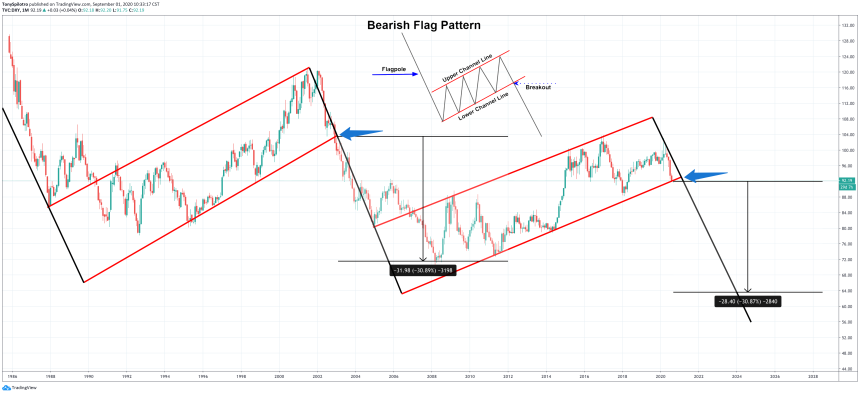
DXY Dollar Currency Index Bear Flag Fractal | Source: TradingView
The fractal on DXY price action also follows a textbook bear flag pattern, complete with a long flagpole and an upward slanted parallel channel.
After the bottom trend line breaks down from a bear flag, selling picks up in severity and drives the asset’s price to new lows. The bottom trend line of the bear flag is the same trend line dating back to when the US came out of the Great Recession.
The economic recovery meant the dollar began to boom again. At the same time, however, Bitcoin was born.
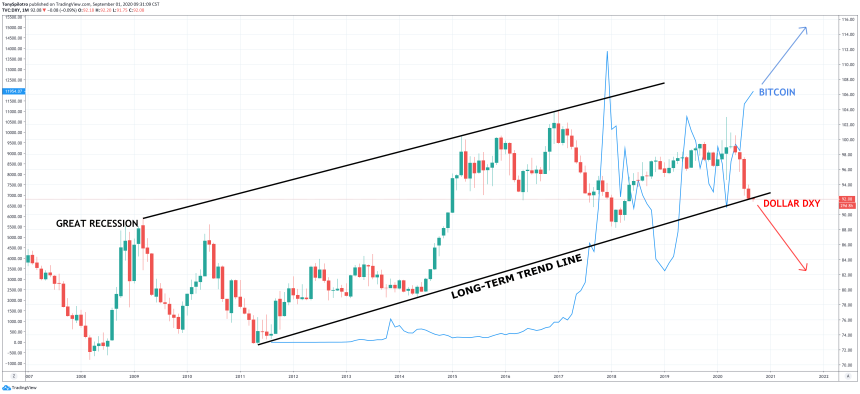
Comparing the long-term price action of the DXY with Bitcoin shows how a fall in the dollar could send the cryptocurrency much higher. The last significant fall in the greenback led to Bitcoin’s $20,000 top – could this next drop create yet another crypto bubble?

DXY Dollar Currency Index Bitcoin BTCUSD Comparison Chart | Source: TradingView
A 15 point fall from roughly 103 to 88 on the index took Bitcoin from under $1,000 to $20,000. The bear flag target on the DXY lies at roughly 64 points by measuring the length of the flag pole.


