
Reason to trust
How Our News is Made
Strict editorial policy that focuses on accuracy, relevance, and impartiality
Ad discliamer
Morbi pretium leo et nisl aliquam mollis. Quisque arcu lorem, ultricies quis pellentesque nec, ullamcorper eu odio.
Ripple declined sharply after it broke the $0.2700 support against the US Dollar, while bitcoin and ETH remained above weekly lows. XRP price is currently recovering, but it could fail near $0.2700.
- Ripple is down over 4% and it broke the $0.2720 and $0.2700 support levels against the US dollar.
- The price traded to a new weekly low at $0.2537 and it is currently recovering higher.
- There is a major bearish trend line forming with resistance near $0.2705 on the 4-hours chart of the XRP/USD pair (data source from Kraken).
- The pair is resume its decline as long as it is below $0.2720 and the 100 simple moving average (4-hours).
Ripple Price Turns Red
Yesterday, we discussed the key reasons why ripple could decline sharply below $0.2700. XRP price did fail to break the $0.2840 resistance, resulting in a sharp decline below $0.2720 and $0.2700.
The price fell over 4% and it even broke the $0.2650 support. It traded to a new weekly low at $0.2537 and it is currently recovering higher. There was a break above the $0.2600 resistance level, plus the 23.6% Fib retracement level of the recent decline from the $0.2811 high to $0.2537 low.
The bulls are currently facing resistance near the $0.2675 level. The 50% traded to a new weekly low at $0.2537 and it is currently recovering higher is acting as a resistance.
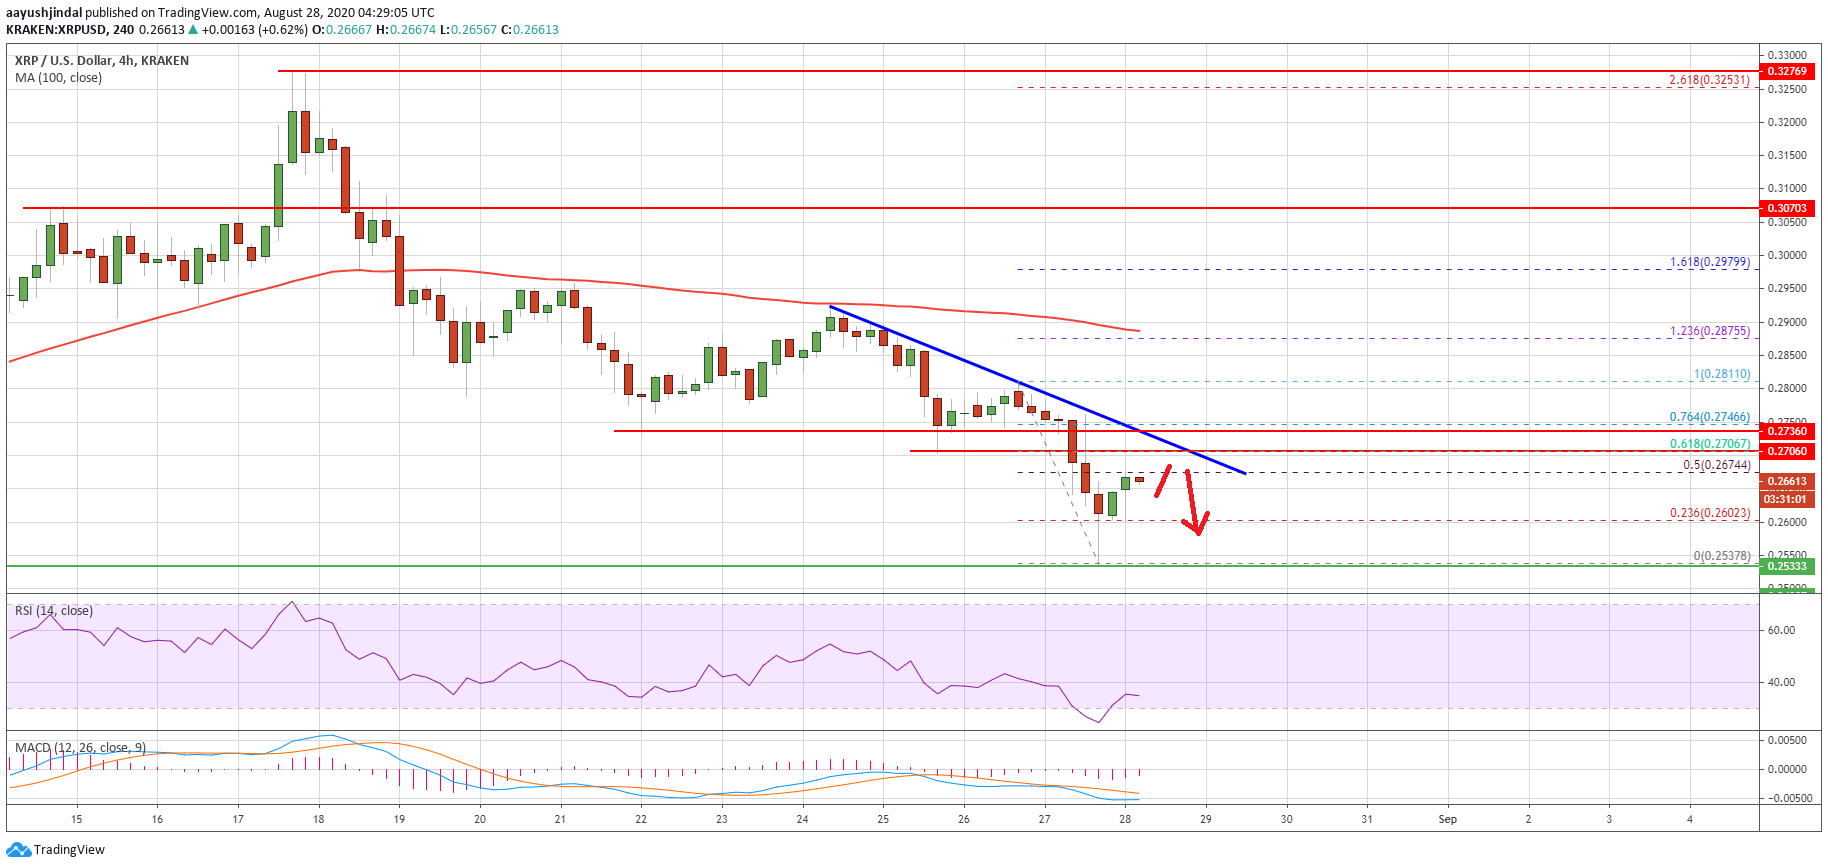
Ripple (XRP) price trades below $0.2700. Source: TradingView.com
There is also a major bearish trend line forming with resistance near $0.2705 on the 4-hours chart of the XRP/USD pair. It seems like the previous resistance zone near the $0.2700 may now act as a strong selling zone in the coming sessions.
If there is an upside break above the trend line, ripple could recover towards the $0.2800 resistance level. The next key resistance is near the 100 simple moving average (4-hours) at $0.2880.
Fresh Decline in XRP?
If ripple fails to clear the $0.2675 and $0.2700 resistance levels, there is a risk of another bearish reaction. An initial support is near the $0.2620 level.
The main support is near the $0.2540 and $0.2520 levels, below which the price could dive towards $0.2440. More importantly, if XRP stays in a bearish zone below $0.2700, it could drag other altcoins lower in the near term.
Technical Indicators
4-Hours MACD – The MACD for XRP/USD is slowly losing pace in the bearish zone.
4-Hours RSI (Relative Strength Index) – The RSI for XRP/USD is currently well below the 40 level.
Major Support Levels – $0.2620, $0.2600 and $0.2550.
Major Resistance Levels – $0.2675, $0.2700 and $0.2720.