Bitcoin price is up well over 60% year-to-date, and has recovered 200% from the Black Thursday low. The cryptocurrency broke free from downtrend resistance, and all signs point to a new uptrend well underway.
However, assets never move up in a straight line, and corrections are often healthy for long-term growth. A near-perfect top-sniping indicator may be warning that a short-term top is here. But the first-ever cryptocurrency may have another, final bullish impulse left before things cool off for a while.
Has The Next Cryptocurrency Bull Market Already Begun?
Bitcoin, historically, is one of the most volatile assets to ever exist. It often rises a few thousand percent during bull runs, only to later correct as much as 80 to 90% during bear market drawdowns.
Still, those who sell high and buy low, can make a fortune on the best performing asset of all time.
The cryptocurrency rocketed to superstardom in 2017, becoming a household name after topping out at $20,000. Now, nearly three full years later and a bear market now behind us, Bitcoin is ready for another uptrend.
Related Reading | Why This Weekly Close In Bitcoin Is Critical For Bullish Continuation
Downtrend resistance is now cleared. The FOMO trigger of $10,000 is now support. The asset’s halving has passed, and any miner-driven death spiral has been narrowly avoided.
All that’s left is a strong impulse move higher. But after such strong yearly performance, a steady uptrend since March, and investors sitting in substantial profit, a short-term top could be near. Sentiment is also at the longest stretch of extreme greed in history.
Coinciding with all these other bearish factors, a valuation-based indicator that in the past has accurately called tops in the cryptocurrency perfectly is now saying a top could be near.
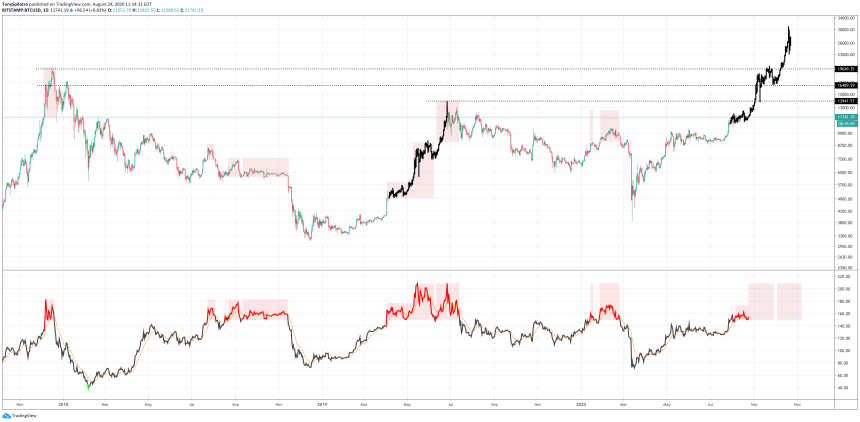
BTCUSD Daily NVT Ratio Signals Top | Source: TradingView
Bitcoin NVT Signal Points To Top Soon, But Powerful Parabolic Impulse Is Still Possible
The NVT signal, or network value to transactions ratio, helps to signal when Bitcoin price is overvalued compared to the total value being transacted across its network. In the past, when this signal turns red, it says a top is near.
It triggered at Bitcoin’s $20,000 peak, again in late 2018 before the plunge to bear market lows. The indicator’s movements during that phase, eerily resemble the current oscillations on the NVT signal.
If the indicator is correct, and price action mimics late 2018, a big crash could be on the way. But there was one major anomaly on the NVT signal, which could suggest there’s one more, major impulse move left in Bitcoin before the asset cools off for some time again.

According to the NVT, it would have signaled a top in Bitcoin back in early 2019, just after breaking out above $4,000. The NVT lit up red, much like it is now.
But what followed was another two months of powerful, parabolic price action. Interestingly, the NVT indicator movement also appears to match the peaks and troughs of the NVT signal back then.

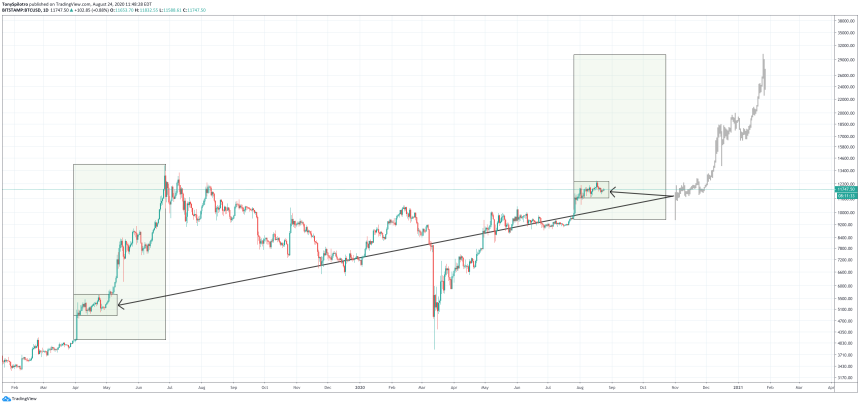
BTCUSD Daily NVT Parabolic Rally Fractal $30,000 Target | Source: TradingView
Even more striking, is the fact that price action almost perfectly resembles the consolidation phase just before the cryptocurrency exploded through $10,000, and set its 2019 high at $14,000.
When the NVT first signaled, the top wasn’t in fact in, and any investors who took action based on the signal, would have missed out on nearly $10,000 in returns.
Related Reading | This Tool Has Called Nearly Every Bitcoin Top, And It Just Triggered Again
If the same sort of impulsive move happens again, Bitcoin price could trade as high as $30,000 per BTC before another extended downtrend to confirmed past resistance as support.
Clearly, Bitcoin is at a crossroads, and even some of the most reliable indicators in the crypto industry are currently confused, and sending mixed signals.


