
Reason to trust
How Our News is Made
Strict editorial policy that focuses on accuracy, relevance, and impartiality
Ad discliamer
Morbi pretium leo et nisl aliquam mollis. Quisque arcu lorem, ultricies quis pellentesque nec, ullamcorper eu odio.
Ripple started a steady recovery above the $0.2800 level against the US Dollar. XRP price is likely to continue higher towards the $0.2950 and $0.3000 resistance levels.
- Ripple remained stable above $0.2720 and recovered above $0.2800 against the US dollar.
- The price is currently trading above the $0.2840 level and the 100 hourly SMA.
- There is a rising channel forming with support near $0.2820 on the hourly chart of the XRP/USD pair (data source from Kraken).
- The pair could continue to recover towards $0.3000 as long as it is above $0.2780.
Ripple Price is Recovering Higher
After trading as low as $0.2732, ripple started a steady recovery. XRP price climbed above $0.2780 and $0.2800 to move into a positive zone and start a decent recovery wave.
There was also a break above a connecting bearish trend line with resistance near $0.2840 on the hourly chart of the XRP/USD pair. The pair is now trading above the $0.2850 level, the 100 hourly simple moving average, and the 50% Fib retracement level of the downward move from the $0.2958 high to $0.2732 low.
An immediate resistance on the upside is near the $0.2870 level. It is close to the 61.8% Fib retracement level of the downward move from the $0.2958 high to $0.2732 low.
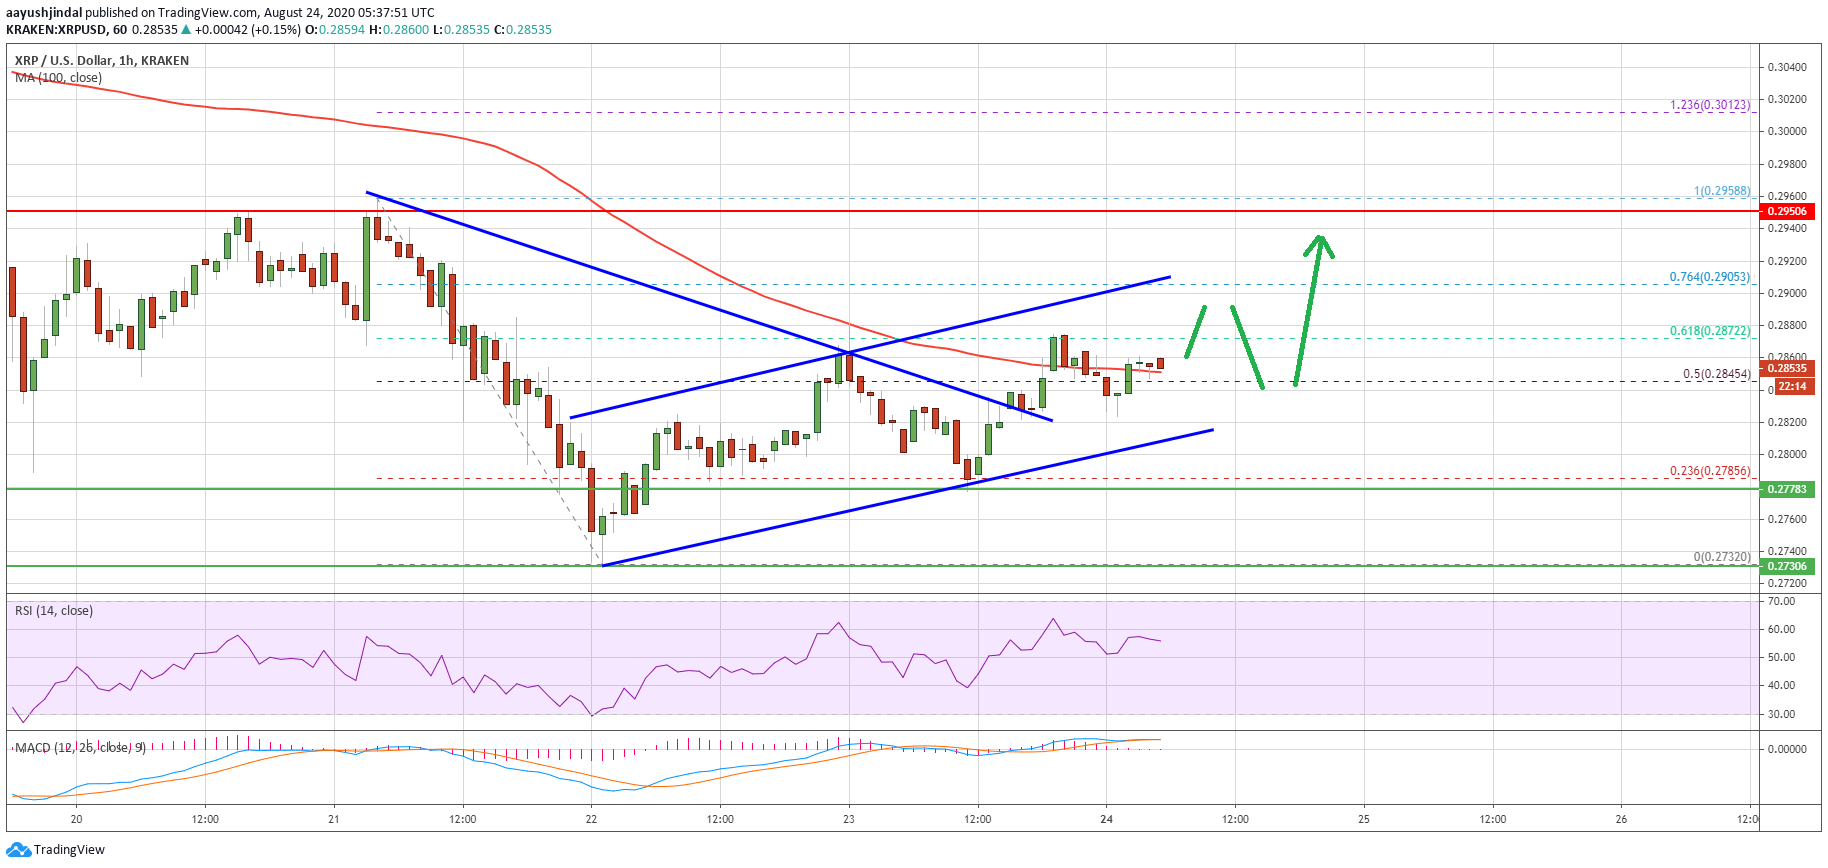
Ripple price trades above $0.2850. Source: TradingView.com
More importantly, the price seems to be following a rising channel with support near $0.2820 on the same chart. The channel resistance is near the $0.2905 level, above which the price might test the $0.2950 resistance zone in the near term.
Any further gains will most likely initiate a push towards the $0.3000 and $0.3020 resistance levels. The next stop for the bulls could be near the $0.3055 pivot level.
Downside Break in XRP?
If ripple struggles to climb above the $0.2905 and $0.2950 resistance levels, there could be a bearish reaction. An initial support is near the $0.2820 level and the channel lower trend line.
If there is a downside break below the channel support, the price could retest $0.2780. Any further losses might start another bearish wave and the price could even decline below the $0.2720 support level.
Technical Indicators
Hourly MACD – The MACD for XRP/USD is slowly gaining strength in the bullish zone.
Hourly RSI (Relative Strength Index) – The RSI for XRP/USD is rising and it is now well above the 50 level.
Major Support Levels – $0.2820, $0.2780 and $0.2720.
Major Resistance Levels – $0.2905, $0.2950 and $0.3000.


