
Reason to trust
How Our News is Made
Strict editorial policy that focuses on accuracy, relevance, and impartiality
Ad discliamer
Morbi pretium leo et nisl aliquam mollis. Quisque arcu lorem, ultricies quis pellentesque nec, ullamcorper eu odio.
Ripple is holding a couple of important supports near $0.2800 against the US Dollar. XRP price is currently testing a crucial resistance near $0.2980, above which it could rally significantly.
- Ripple is trading above the $0.2800 and $0.2850 support levels against the US dollar.
- The price is showing positive signs, but it is facing a huge barrier near the $0.2980-$0.3000 zone.
- There is a key bullish trend line with support near $0.2810 on the 4-hours chart of the XRP/USD pair (data source from Kraken).
- The pair is likely to start a strong increase if it clears $0.2980 and the 100 simple moving average (4-hours).
Ripple Price Is Testing Major Barrier
After a sustained downward move, ripple found support near the $0.2800 region. A low is formed near the $0.2790 level and XRP price is currently correcting higher.
There was an upside break above the $0.2850 and $0.2900 resistance levels. The price even climbed above the 23.6% Fib retracement level of the downward move from the $0.3274 high to $0.2790 low.
There is also a key bullish trend line with support near $0.2810 on the 4-hours chart of the XRP/USD pair. The pair is now trading above the $0.2920 pivot level, but it is facing a huge barrier near the $0.2980-$0.3000 zone. The 100 simple moving average (4-hours) is also near the $0.2980 level to prevent an upside break.
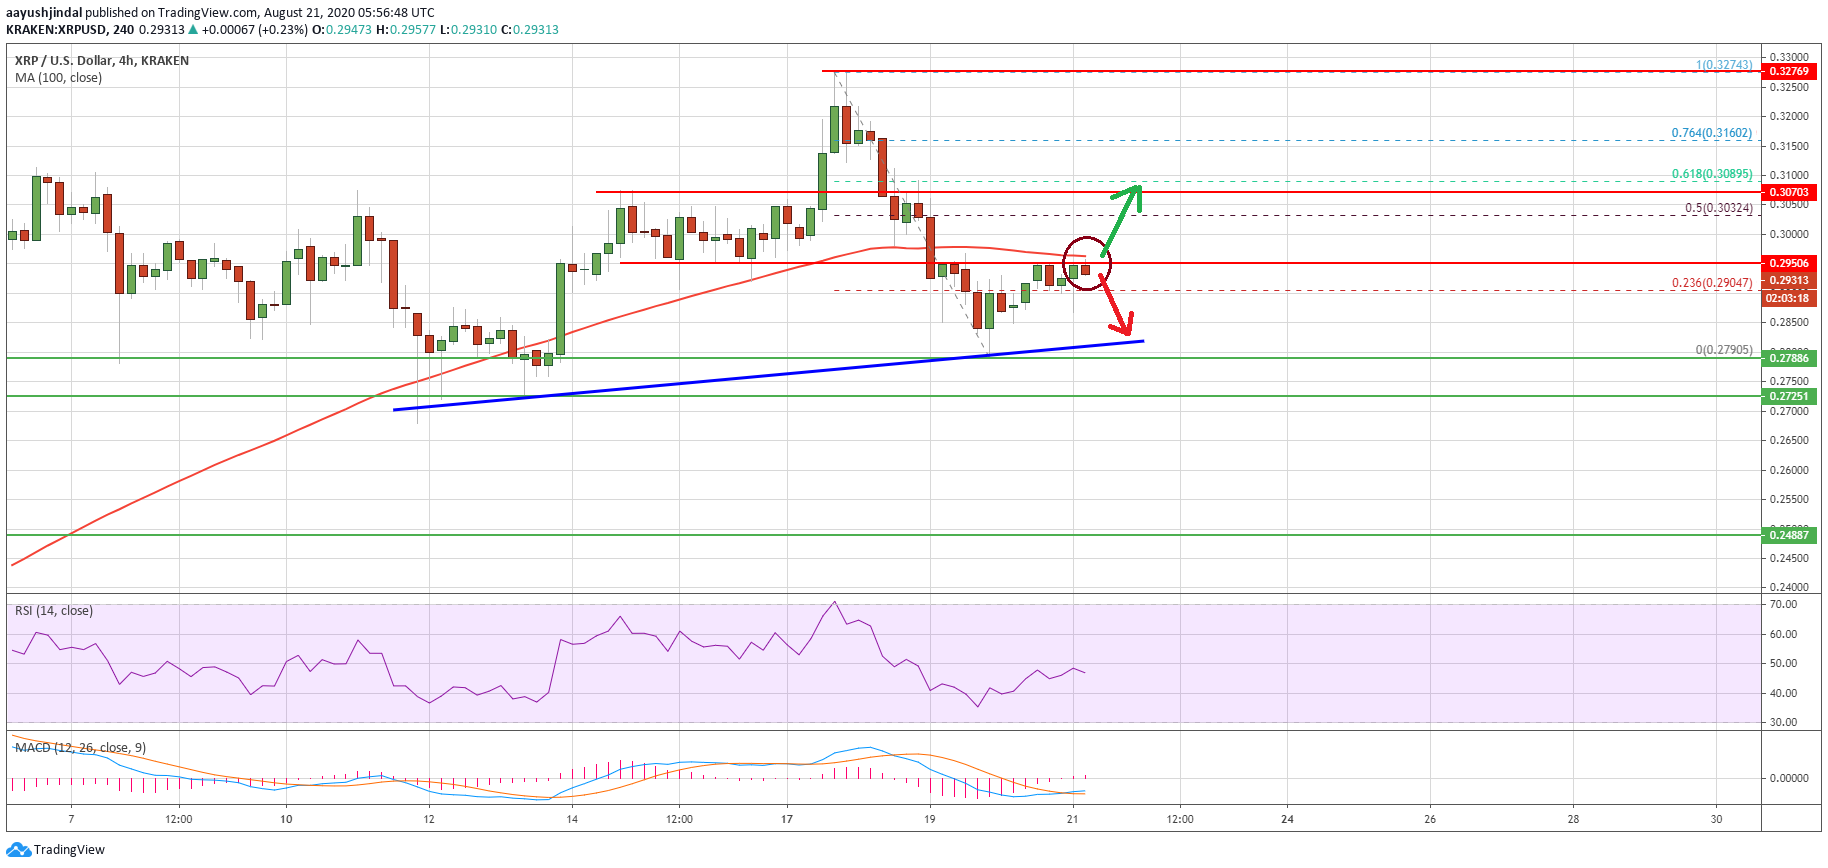
Ripple (XRP) price trades near $0.2980. Source: TradingView.com
If there is a clear break above the $0.3000 resistance and the 100 SMA, there could be a sharp increase. The next hurdle is seen near the $0.3030 level. It is close to the 50% Fib retracement level of the downward move from the $0.3274 high to $0.2790 low.
A successful close above the $0.3000 and $0.3030 resistance levels might open the doors for a sustained upward move towards the $0.3120 level. Any further gains could lead the price towards the $0.3250 resistance level or the $0.3274 swing high. The next target for the bulls above $0.3274 might be $0.3320.
Bearish Wave in XRP?
If ripple fails to clear the $0.3000 and $0.3030 resistance levels, there is a risk of a bearish reaction. An initial support is near the $0.2880 level.
The main support is near the $0.2850 level and a connecting bullish trend line. A clear break below the $0.2850 level might set the pace for a larger decline towards the $0.2650 level.
Technical Indicators
4-Hours MACD – The MACD for XRP/USD is slowly moving into the bullish zone.
4-Hours RSI (Relative Strength Index) – The RSI for XRP/USD is currently struggling to clear the 50 level.
Major Support Levels – $0.2880, $0.2850 and $0.2800.
Major Resistance Levels – $0.2980, $0.3000 and $0.3030.


