
Reason to trust
How Our News is Made
Strict editorial policy that focuses on accuracy, relevance, and impartiality
Ad discliamer
Morbi pretium leo et nisl aliquam mollis. Quisque arcu lorem, ultricies quis pellentesque nec, ullamcorper eu odio.
Bitcoin bounced back sharply after testing the $11,500 support zone against the US Dollar. BTC is likely to accelerate higher above $12,000 as long as it is above the 100 hourly SMA.
- Bitcoin is trading well above the $11,800 and $11,500 support levels.
- The price is facing a couple of hurdles near the $12,000 and $12,080 levels.
- There was a break above a key bearish trend line with resistance near $11,880 on the hourly chart of the BTC/USD pair (data feed from Kraken).
- The pair must stay above the 100 hourly simple moving average to clear the $12,000 resistance.
Bitcoin Price is Holding Uptrend
After forming a short-term top near $12,080, bitcoin price corrected lower against the US Dollar. BTC broke the $11,800 support level and dived more than $500. It traded close to the $11,500 support area, where the bulls appeared.
A swing low is formed near $11,536 and recently the price bounced back sharply. It climbed back above the $11,800 resistance and the 100 hourly simple moving average. The bulls pushed the price above the 50% Fib retracement level of the sharp decline from the $12,084 high to $11,536 swing low.
Moreover, there was a break above a key bearish trend line with resistance near $11,880 on the hourly chart of the BTC/USD pair. The pair is currently approaching the $11,950 and $12,000 levels.
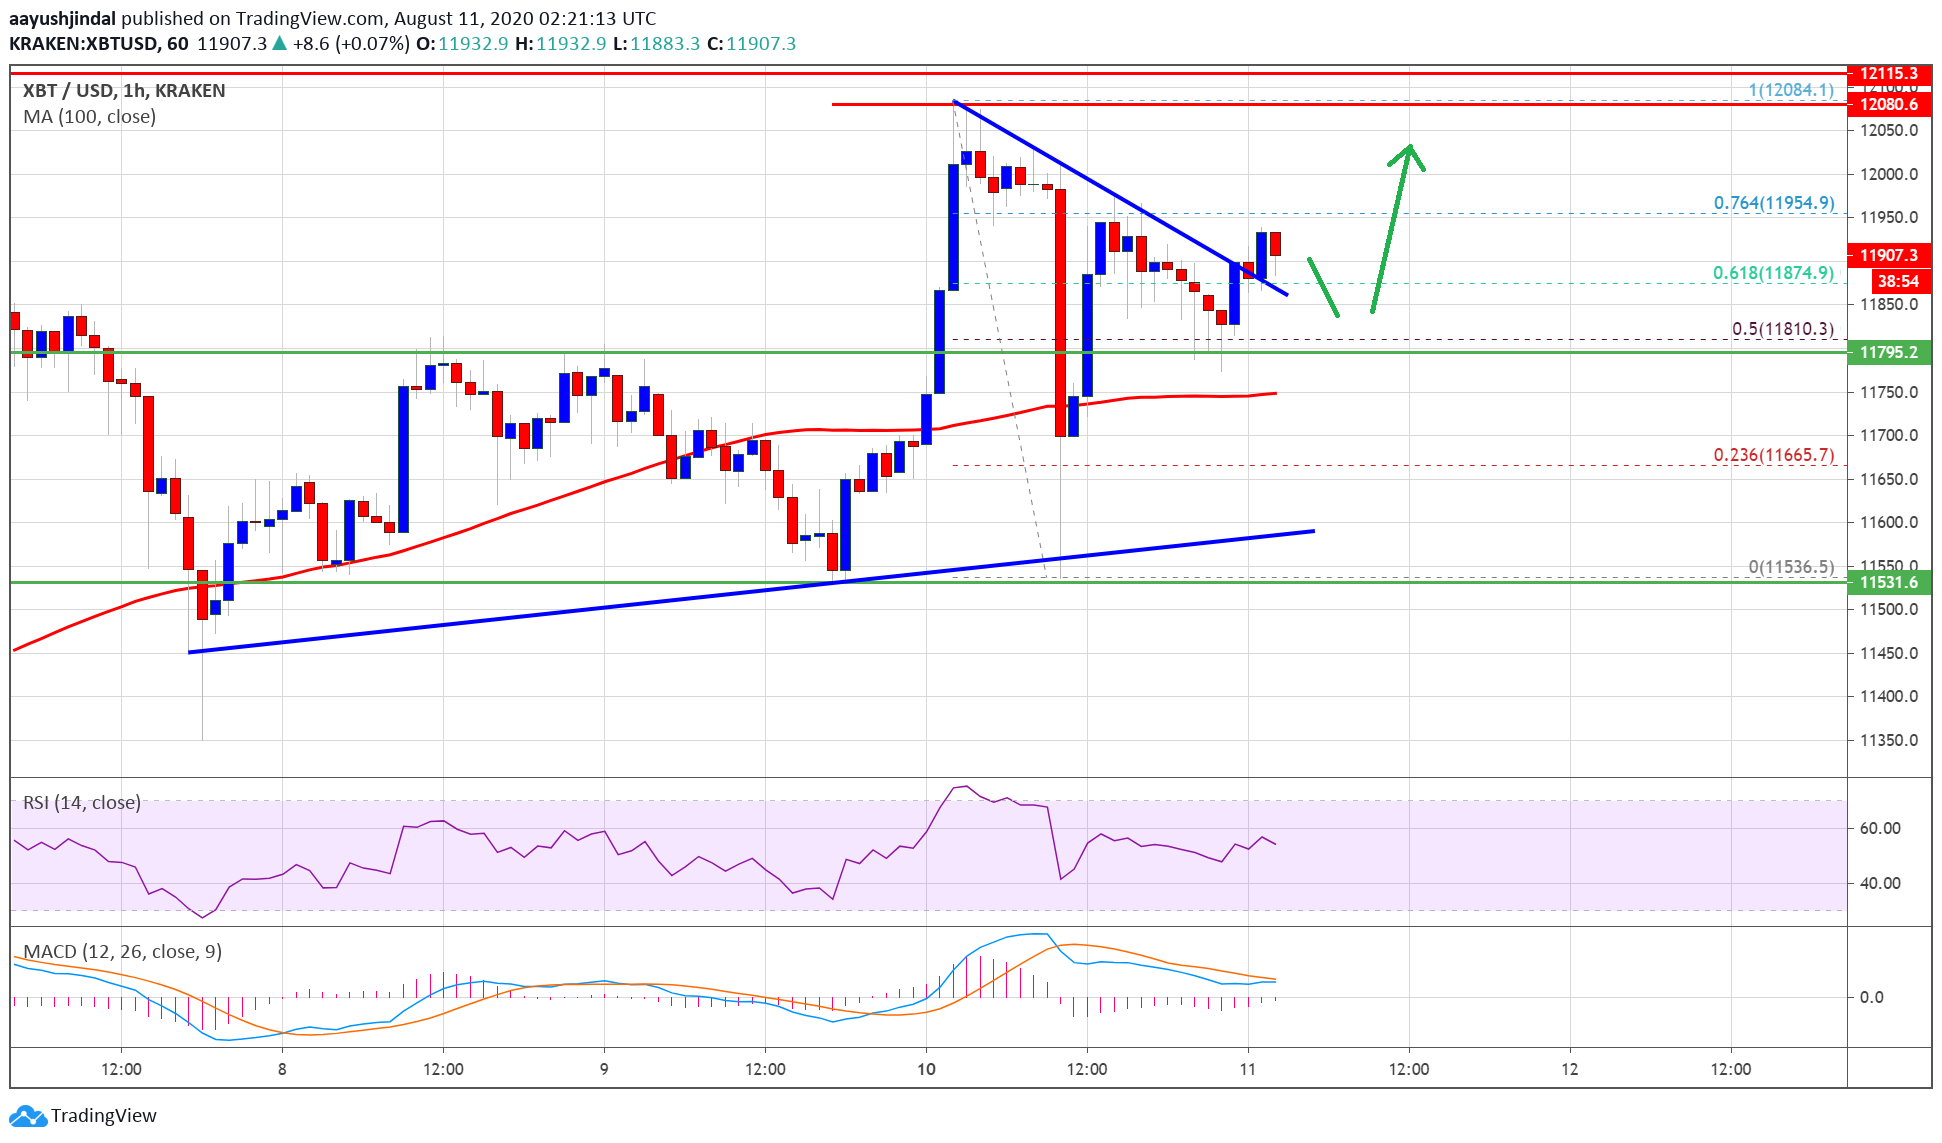
Bitcoin price trades above $11,800. Source: TradingView.com
The 76.4% Fib retracement level of the sharp decline from the $12,084 high to $11,536 swing low could act as an immediate resistance in the near term at $11,950. A clear break above the $11,950 level could increase the chances of a push above the $12,000 level.
The next resistance is near the $12,080 level, above which the bulls are likely to aim more upsides above the $12,200 and $12,250 levels.
100 SMA Holds The Key For BTC
If bitcoin fails to reclaim the $12,000 resistance, it could correct lower in the short term. A key support seems to be forming near the $11,700 level and the 100 hourly SMA.
If there is a downside break below the $11,700 support and the 100 hourly SMA, the price could retest the $11,500 support zone. Any further gains could lead the price towards $11,200.
Technical indicators:
Hourly MACD – The MACD is slowly moving into the bullish zone.
Hourly RSI (Relative Strength Index) – The RSI for BTC/USD is currently just above the 50 level.
Major Support Levels – $11,700, followed by $11,500.
Major Resistance Levels – $11,950, $12,000 and $12,080.


