Reason to trust

How Our News is Made
Strict editorial policy that focuses on accuracy, relevance, and impartiality
Ad discliamer
Morbi pretium leo et nisl aliquam mollis. Quisque arcu lorem, ultricies quis pellentesque nec, ullamcorper eu odio.
Band protocol may be following in Chainlink’s fiery footsteps, rising nearly 9000% in the last few months. The crypto altcoin has gone fully parabolic, which has rewarded early investors handsomely.
However, when parabolic advances break down, they often correct by 80% or more. Is the altcoin headed towards a deep correction, or will the asset simply keep on climbing?
Top Crypto Asset Go Parabolic, Past Data Suggests Risk Of Correction Increases By The Day
What goes up, must come down. The bigger they are, the harder they fall. So many idioms created just to reference that anything growing beyond acceptable boundaries eventually gets cut back down to size.
That’s exactly what happens when financial assets go on enormous rallies. No matter the asset, even the strongest uptrends eventually top and reverse, leading to a correction.
Related Reading | Peter Brandt Calls For 80%+ Bitcoin Price Decline Over A Year Ago With Chilling Accuracy
How deep a correction goes is largely dependant on the asset itself, and its price history leading up to the top. If the asset experienced a long, slow, and steady climb, then any pullbacks will likely be short-lived and healthy.
If the rally was explosive and fast, well, the correction is likely to be just as violent, if not more so. The same thing happened with Bitcoin after the 2017 top at $20,000. The first-ever cryptocurrency dropped by over 80% to its bottom at $3,200.
The same math adds up on nearly every other asset to break its parabolic advance. That’s why Band protocol, is at risk of a deep correction once a reversal begins and parabolic breaks.
BANDUSD Parabolic Curve | Source: TradingView
Bearish BAND Protocol Signals Back Up Coming Correction Concept
The BANDUSD price chart shows the asset going on an insane, over 9000% rally over the last 6 months. It has been following closely along behind Chainlink, another competing decentralized oracle project.
Both assets have been on an unstoppable climb, even though nearly every sell signal is stacked against the assets. When Band’s parabolic advance does break down, it could send the crypto altcoin to a target of roughly $4.

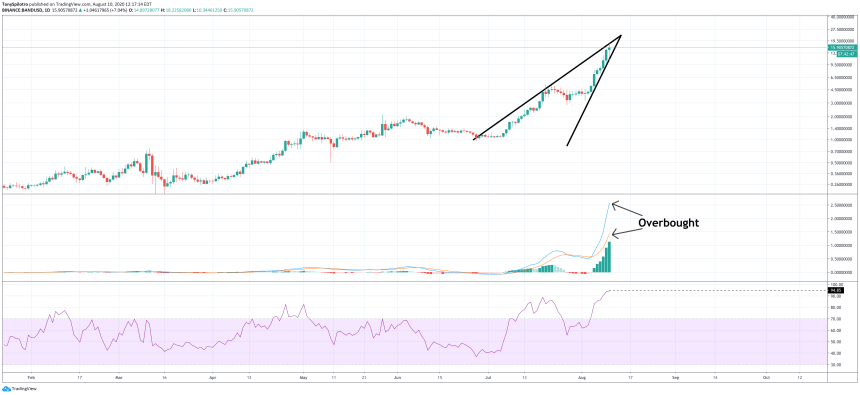
BANDUSD Daily Ascending Wedge, RSI, and MACD | Source: TradingView
Coinciding with the parabolic curve, nearly every technical analysis indicator is showing heavily overbought conditions. A massive, ascending wedge on the daily also forewarns of the deep drop that may soon follow once the asset tops.
Related Reading | What’s Behind Band Protocol’s Spectacular One-Month 300% Pump?
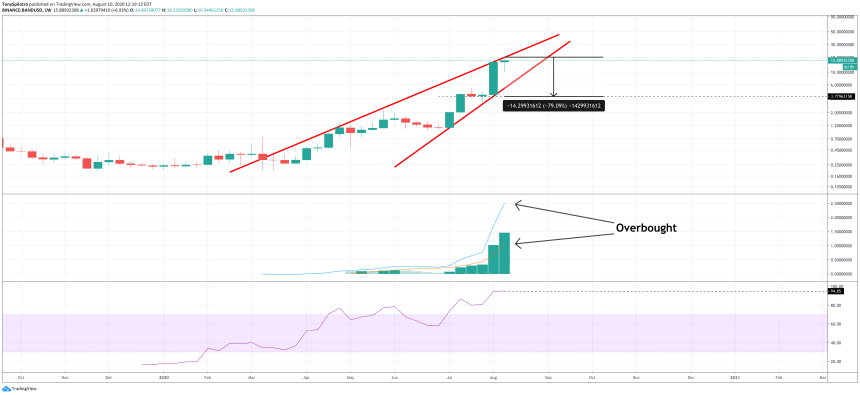
On weekly timeframes, BAND is trading within an even larger ascending wedge, and indicators show a similar story in terms of overbought conditions.

BANDUSD Weekly Ascending Wedge, RSI, and MACD | Source: TradingView
But as Chainlink has shown, the top may be a lot higher than anyone ever expects. These two altcoins are in full price discovery mode, allowing them to run with little resistance above.
Any top will coincide with major players taking profit, not due to a resistance level the asset must flip to support, as none exists above.


