Bitcoin attempted to shatter its $12,000 resistance yesterday, which ultimately resulted in a rejection that led it down towards $11,700.
At this price level, however, buyers stepped up and absorbed the heavy selling pressure, subsequently pushing the benchmark cryptocurrency up towards $11,900 before its momentum began slowing.
The key resistance that sits just above its current price level is significant and may continue hampering its growth in the days and weeks to come.
One analyst is even noting that he expects this level to spark a prolonged consolidation phase that could extend for multiple months.
This means BTC may see a prolonged bout of range-bound trading between $10,300 and $12,000 while it tries to garner greater buying pressure.
The analyst does also believes that this consolidation phase will ultimately result in a break above the upper boundary of this trading range – which will send it towards $13,000.
Bitcoin May Enter a Consolidation Phase Until November – Claims Analyst
Bitcoin and the aggregated cryptocurrency market is currently struggling to build momentum as it trades just beneath the heavy resistance that has been established at $12,000.
Overnight, bulls attempted to shatter this resistance when they pushed the crypto up towards $12,100, but the selling pressure here proved to be too significant, and its price eventually saw a sharp downturn that led it to lows of $11,700.
These lows were ardently defended by bulls, however, who stopped the crypto from seeing any sizeable losses.
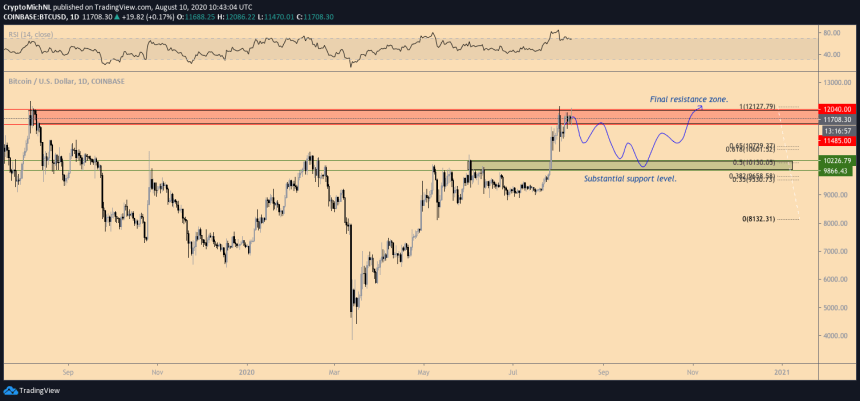
One analyst is now noting that this recent price action may confirm his theory that BTC is poised to see a multi-month consolidation phase that leads it to trade between $10,200 and $12,000 for the coming few months.
He explains:
“Smaller timeframe chart explaining what just happened. Essentially, we’re back in to the ranging gameplan. Larger timeframe; still expecting such a scenario. If we break $12K however, I assume we’ll see $13k.”

Image Courtesy of Crypto Michael. Chart via TradingView.
BTC Continues Respecting Key Technical Level
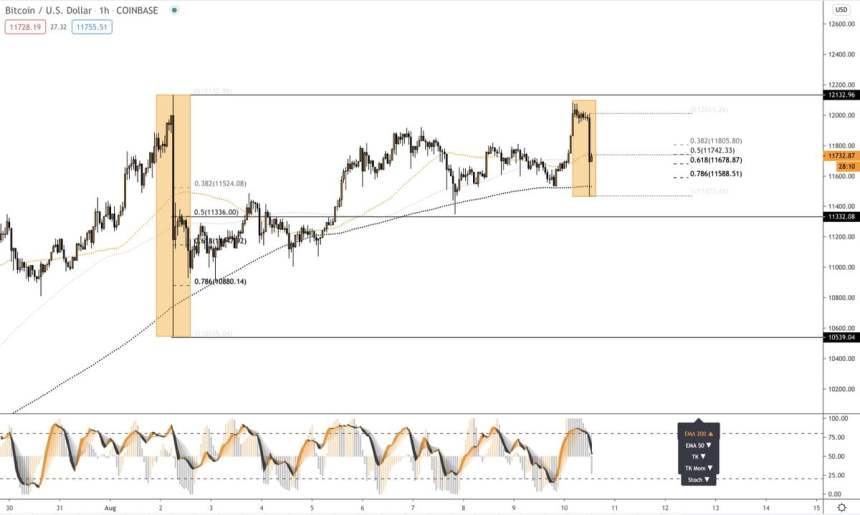
Another analyst observed in a chart that Bitcoin’s latest drop towards $11,700 is strikingly similar to that seen last Saturday.
As seen in the chart below, the cryptocurrency now appears to be trading within a range between $11,300 and $12,100, with its price respecting a key moving average.

Image Courtesy of CryptoBirb. Chart via TradingView.
As long as these levels hold in the near-term, it will likely continue chipping away at the $12,000 resistance it is currently facing.
If Bitcoin is unable to break above this resistance in the near-term, it may confirm the aforementioned consolidation phase.
Featured image from Unsplash.
Charts from TradingView.


