Reason to trust

How Our News is Made
Strict editorial policy that focuses on accuracy, relevance, and impartiality
Ad discliamer
Morbi pretium leo et nisl aliquam mollis. Quisque arcu lorem, ultricies quis pellentesque nec, ullamcorper eu odio.
XRP has been incurring some incredibly strong price action throughout the past few days, allowing it to erase some of the underperformance it had been experiencing throughout the past several weeks.
The cryptocurrency is now pushing up against a crucial resistance level that has yet to be broken above for an extended period of time.
One analyst is noting that this level may continue acting as strong resistance in the days ahead, with another rejection here potentially doing significant damage to its near-term outlook.
There is one striking fractal that suggests XRP could be in the early stages of its next parabolic push higher.
Whether or not this pattern replicates itself in the near-term will depend on how it reacts to this crucial near-term resistance, and how the aggregated market trends in the coming days and weeks.
XRP’s Rally Stalls as It Reaches Key Resistance; Will It Break Above It?
At the time of writing, XRP is trading up marginally at its current price of $0.30. This is around where its uptrend has stalled throughout the past couple of days after hitting highs of $0.32 earlier this week.
Although it outperformed the entire crypto market this past weekend, its rally has been showing signs of faltering as it struggles to break above $0.32.
The cryptocurrency is now underperforming Bitcoin, Ethereum, and some of its other peers – which are all seeing notable upwards momentum today.
Where it trends next will likely depend on whether or not it is able to shatter the massive selling pressure it is facing between $0.31 and $0.32.
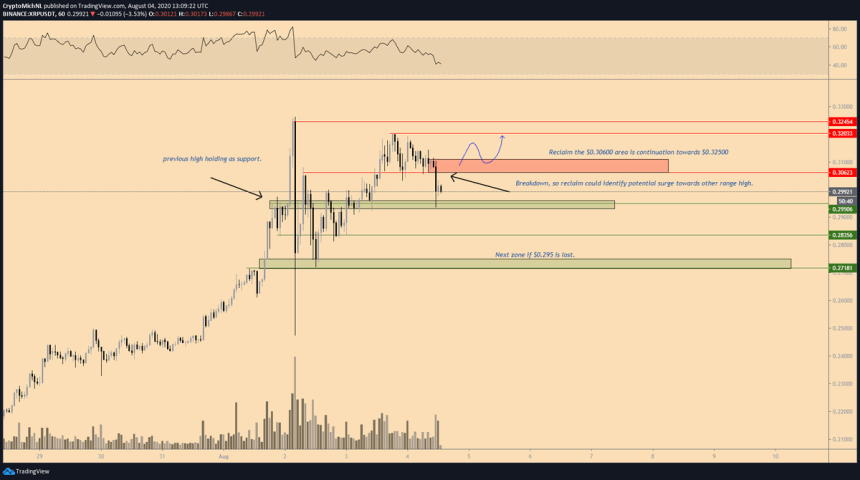
While speaking about this key level, one analyst explained that a break above this area could mark the start of its next leg higher, whereas another rejection here could lead it back into the upper-$0.20 region.
“XRP: Similar picture here. Lost support, which ideally rejects as resistance now. Reclaim and the path is open towards $0.325. Losing $0.295 and we’ll be looking at $0.271.”

Image Courtesy of Crypto Michael. Chart via TradingView.
Is This Resistance the Last Thing Stopping It from Going Parabolic?
The resistance it is currently facing is heavy, and that might mean that a break above it will catalyze a massive influx of buying pressure.
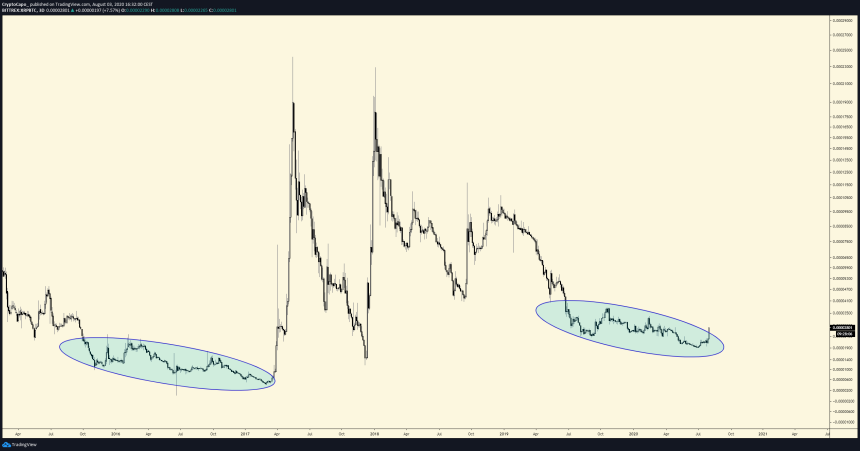
Another popular trader recently put forth a chart showing striking similarities between the price action XRP has seen over the past few months and that seen before its parabolic surge against BTC in early-2017.

Image Courtesy of il Capo of Crypto. Chart via TradingView.
If it breaks above its current resistance and forms another leg higher, this could confirm the fractal seen above, signaling that major upside is imminent.
Featured image from Unsplash.
Charts from TradingView.


