
Reason to trust
How Our News is Made
Strict editorial policy that focuses on accuracy, relevance, and impartiality
Ad discliamer
Morbi pretium leo et nisl aliquam mollis. Quisque arcu lorem, ultricies quis pellentesque nec, ullamcorper eu odio.
Ethereum dived from the $417 swing high and traded below $350 against the US Dollar. ETH price is currently recovering above $375 and it is likely to climb back above $400.
- Ethereum started a sharp decline from the $417 high and dived towards the $300 support.
- The price recovered sharply above $350 and it is now trading above the 100 hourly simple moving average.
- There is a key contracting triangle forming with resistance near $385 on the hourly chart of ETH/USD (data feed via Kraken).
- The pair seems to be setting up for a fresh bullish break above $390 and $400.
Ethereum Price Is Approaching Next Break
After a strong rally above $350 and $400, Ethereum faced a significant bearish move against the US Dollar. A high was formed near $417 before the price tumbled (similar to bitcoin and ripple) below $400 and $350.
The price even spiked below the $330 support level and the 100 hourly simple moving average. However, it found a strong buying interest near $305 and $300. Ether recovered sharply above the $330 and $350 levels.
There was a break above the $365 and $370 levels. The price is now trading near the $385 resistance zone. It is close to the 50% Fib retracement level of the recent decline from the $416 swing high to $353 swing low. It seems like there is a key contracting triangle forming with resistance near $385 on the hourly chart of ETH/USD.
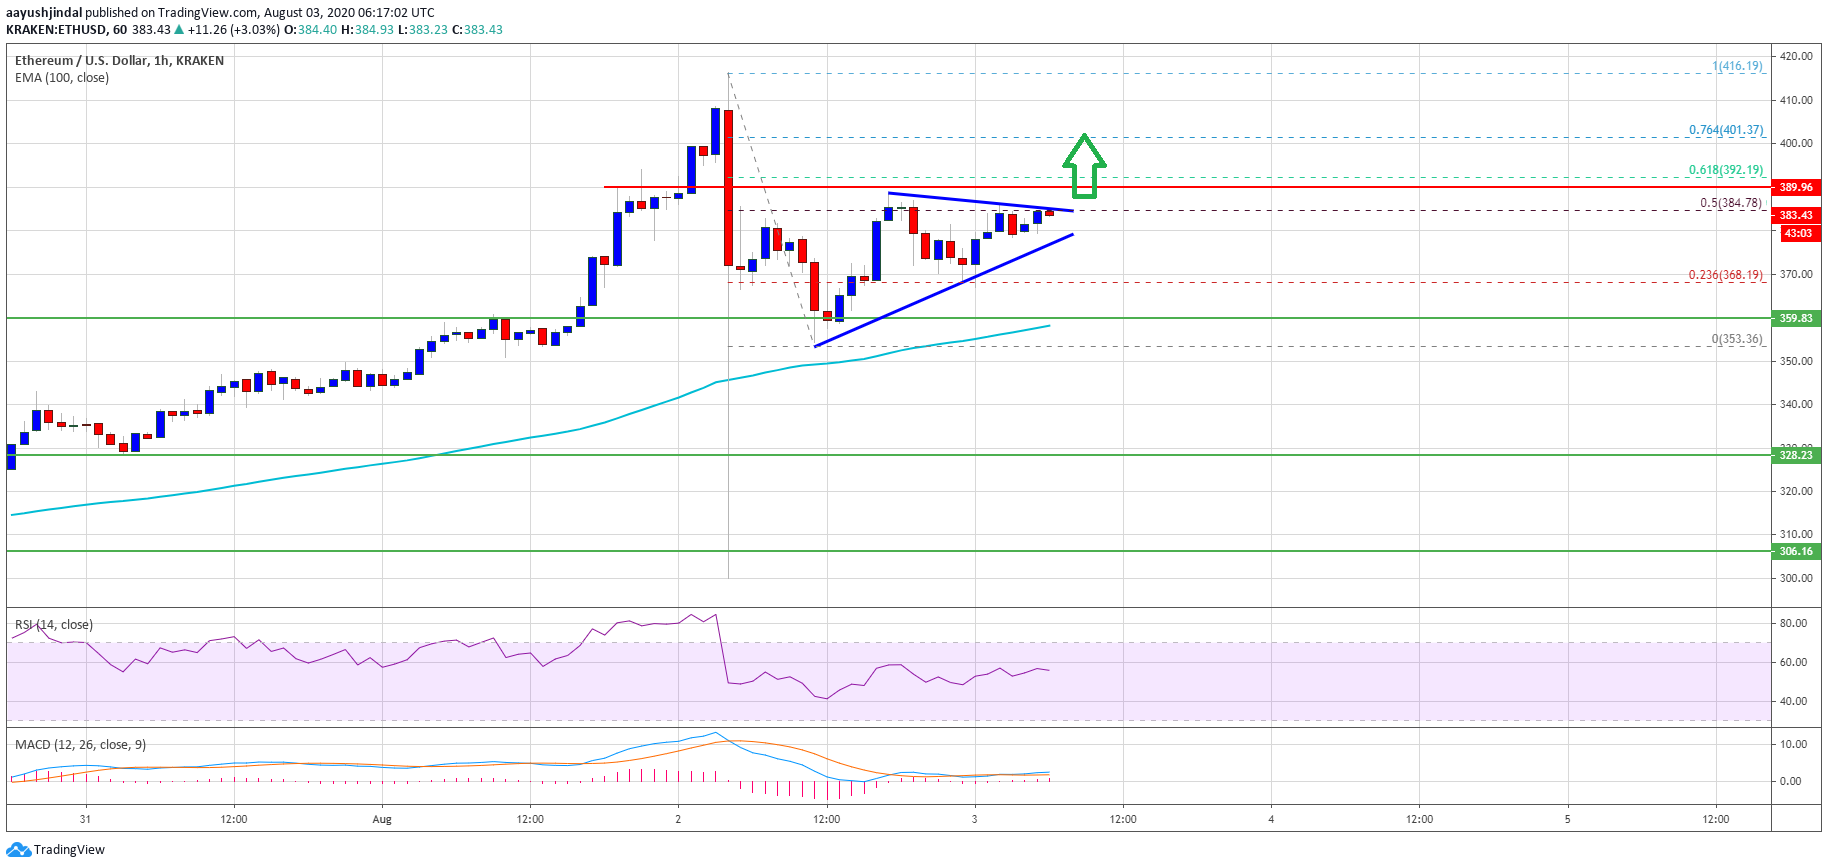
Ethereum price trades above $380. Source: TradingView.com
If ether price breaks the triangle resistance, it could test the $390 resistance. The 61.8% Fib retracement level of the recent decline from the $416 swing high to $353 swing low is also near the $392 level.
A successful break above the triangle resistance and $392 could open the doors for a fresh increase above the $400 level. In the mentioned case, the price is likely to rise towards the $415 and $420 levels in the coming sessions.
Dips Likely To Be Contained in ETH
The triangle support is near the $378 level. If there is a bearish break below the triangle support, Ethereum could test the $365 support.
The next major support is near the $360 level and the 100 hourly SMA, where the bulls are likely to take a strong stand. Any further losses could lead the price towards the $300 handle.
Technical Indicators
Hourly MACD – The MACD for ETH/USD is slowly moving in the bullish zone.
Hourly RSI – The RSI for ETH/USD is now back above the 50 level.
Major Support Level – $365
Major Resistance Level – $392