
Reason to trust
How Our News is Made
Strict editorial policy that focuses on accuracy, relevance, and impartiality
Ad discliamer
Morbi pretium leo et nisl aliquam mollis. Quisque arcu lorem, ultricies quis pellentesque nec, ullamcorper eu odio.
Bitcoin is currently consolidating in a range above the $10,700 support against the US Dollar. BTC is likely to start a fresh surge as long as it is above the 100 hourly SMA.
- Bitcoin is trading in a contracting range above the key $10,700 support zone.
- The price seems to be facing a couple of key hurdles near the $11,200 and $11,250 levels.
- There is a major contracting triangle forming with resistance near $11,240 on the hourly chart of the BTC/USD pair (data feed from Kraken).
- The pair must stay above the 100 hourly SMA and $10,700 to start a fresh surge.
Bitcoin Price is Consolidating Gains
After a strong rally, bitcoin price started consolidating gains below the $11,250 resistance against the US Dollar. BTC corrected lower a couple of times, but it remained well bid above the $10,700 support.
It seems like the bulls are protecting the uptrend above $10,700 and the 100 hourly simple moving average. The recent swing low was formed near $10,828 before the price recovered higher. It surpassed the $11,000 resistance, plus the 50% Fib retracement level of the recent decline from the $11,348 high to $10,828 low.
However, the price seems to be struggling to settle above $11,200 and $11,250 resistance levels. There is also a major contracting triangle forming with resistance near $11,240 on the hourly chart of the BTC/USD pair.
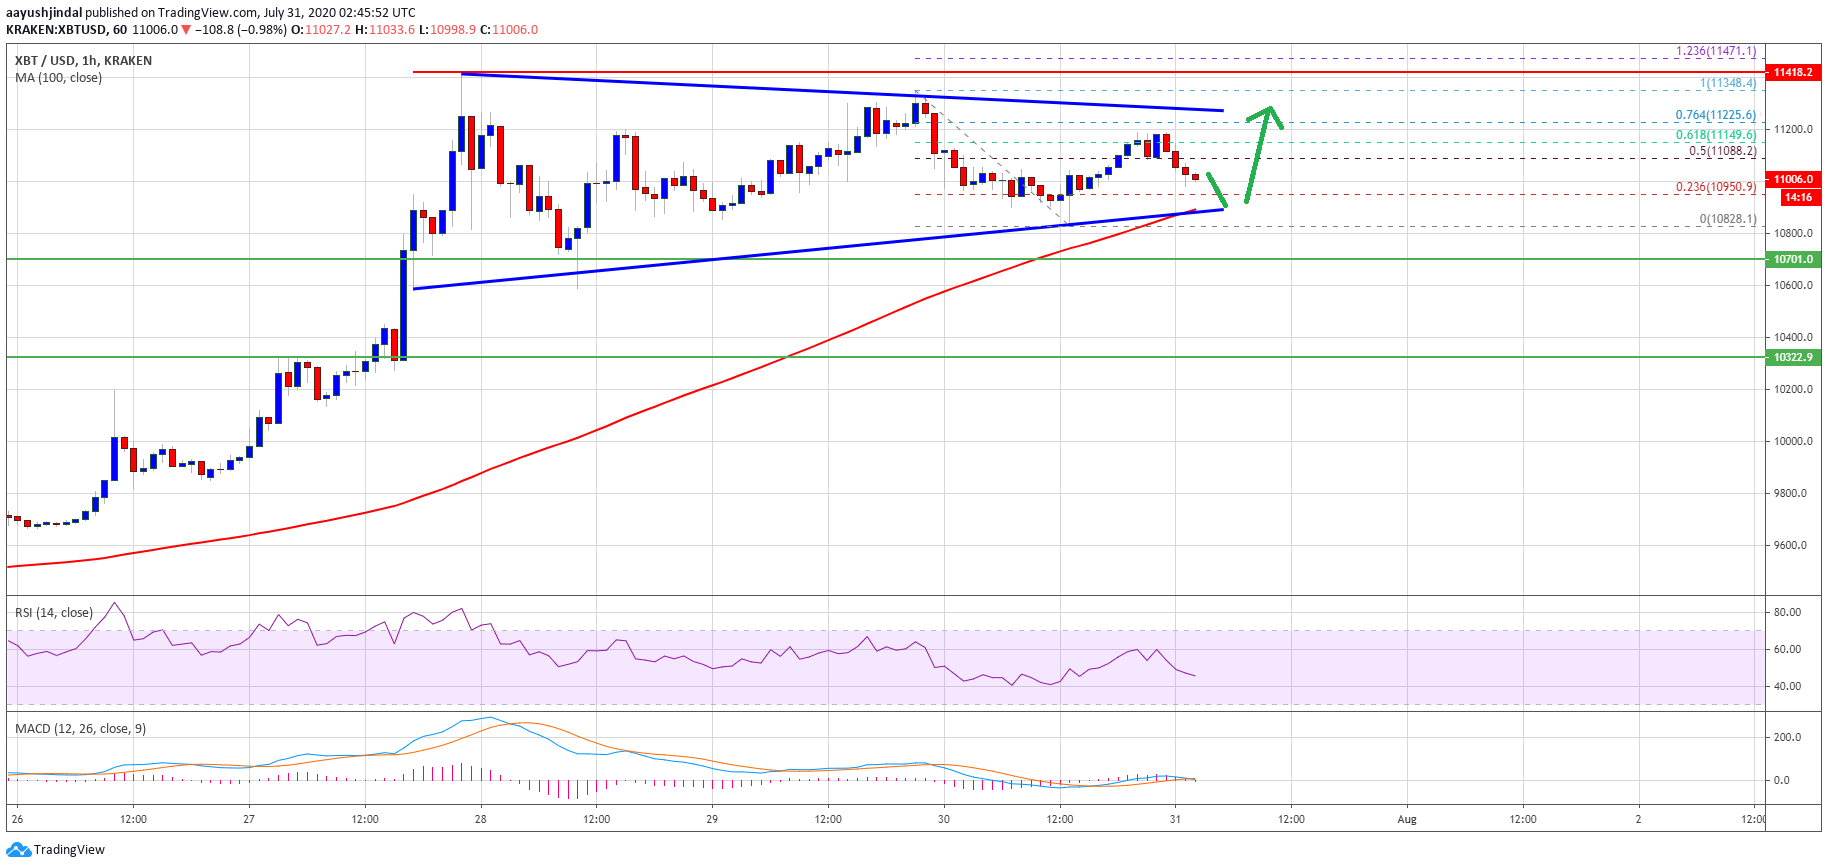
Bitcoin price holding $10,700. Source: TradingView.com
The triangle resistance is close to the 76.4% Fib retracement level of the recent decline from the $11,348 high to $10,828 low. A successful close above the $10,250 resistance may perhaps spark a strong surge.
The next major resistance is near the $11,350 and $11,400 levels, above which the bulls are likely to aim an upside break above the $11,500 resistance level in the coming sessions.
100 SMA Holds The Key For BTC
On the downside, the triangle support is near the $10,850 level and the 100 hourly SMA. If there is a downside break below the $10,850 support, there is a risk of more losses.
The main support is near the $10,700 level, below which the bears are likely to take control in the short-term. In the mentioned case, the price may probably start an extended downside correction towards the $10,500 level.
Technical indicators:
Hourly MACD – The MACD is slowly moving back into the bearish zone.
Hourly RSI (Relative Strength Index) – The RSI for BTC/USD is now below the 50 level, with a bearish angle.
Major Support Levels – $10,850, followed by $10,700.
Major Resistance Levels – $11,250, $11,400 and $11,500.