
Reason to trust
How Our News is Made
Strict editorial policy that focuses on accuracy, relevance, and impartiality
Ad discliamer
Morbi pretium leo et nisl aliquam mollis. Quisque arcu lorem, ultricies quis pellentesque nec, ullamcorper eu odio.
Bitcoin is struggling to stay above the $11,200 resistance level against the US Dollar. BTC is currently correcting lower and it could continue to move down towards $10,700.
- Bitcoin is slowly moving lower after forming an intraday high near the $11,349 level.
- A couple of back-to-back candles suggest that the price might continue lower towards $10,700.
- There was a break below a key bullish trend line with support near $11,150 on the hourly chart of the BTC/USD pair (data feed from Kraken).
- The pair must stay above the $10,700 support level to start a fresh increase in the near term.
Bitcoin Price Struggling To Clear $11,400
Bitcoin price made another attempt to surpass the $11,400 resistance against the US Dollar, but it failed. BTC failed to stay above the $11,200 level and formed an intraday high near the $11,349 level.
It is currently correcting lower below $11,200, but it is well above the 100 hourly simple moving average. During the recent decline, there was a break below a key bullish trend line with support near $11,150 on the hourly chart of the BTC/USD pair.
The pair is now approaching the $10,950 support. It is close to the 50% Fib retracement level of the upward wave from $10,581 swing low to $11,349 high. The first major support is near the $10,850 level.
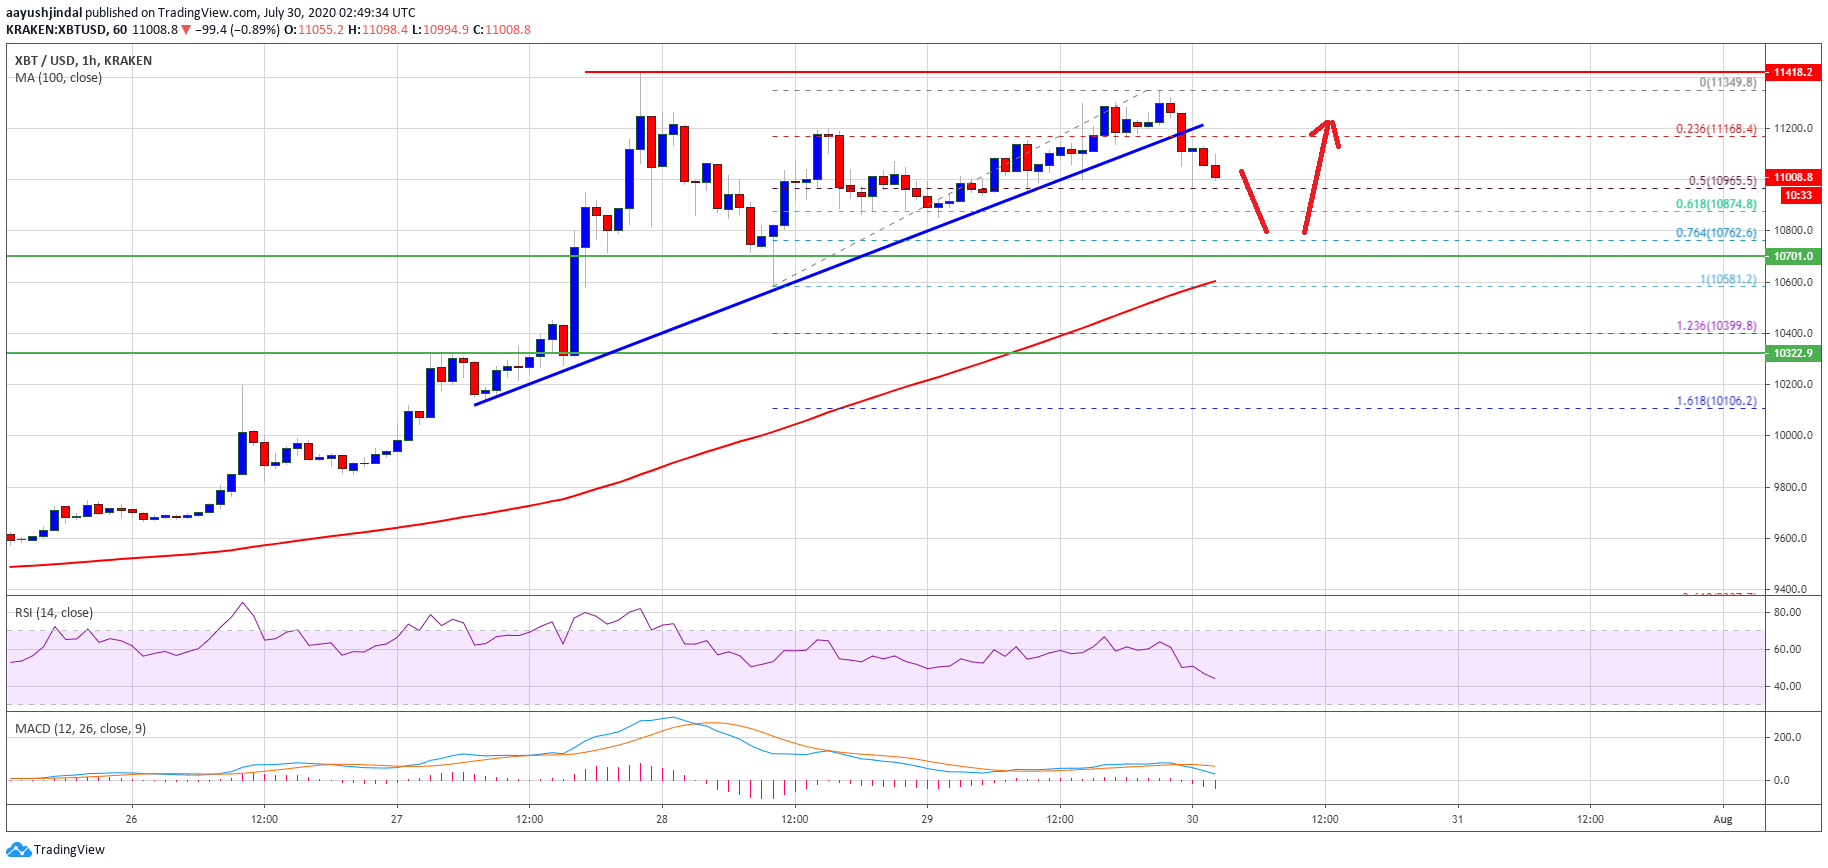
Bitcoin price trades below $11,200. Source: TradingView.com
The next major support is near the $10,700 level (a multi-touch zone). An intermediate support might be the 76.4% Fib retracement level of the upward wave from $10,581 swing low to $11,349 high at $10,760.
If the bulls fail to protect the $10,700 support level, the price could test the 100 hourly simple moving average. Any further losses may perhaps lead the price towards the main $10,300 support zone.
Dips in BTC Present Buying Opportunity?
Clearly, bitcoin is showing early signs of struggle near the $11,200 and $11,400 levels. Having said that, the current formation could be just a consolidation phase above $10,700 and $10,300.
As long as the price is trading above the $10,700 and $10,300 support levels, it is likely to resume its upward move. Any further losses may probably start an extended downside correction and the price could even dive below the $10,000 support.
Technical indicators:
Hourly MACD – The MACD is currently gaining pace in the bearish zone.
Hourly RSI (Relative Strength Index) – The RSI for BTC/USD is now below the 50 level, with bearish signs.
Major Support Levels – $10,850, followed by $10,700.
Major Resistance Levels – $11,200, $11,400 and $11,500.


