
Reason to trust
How Our News is Made
Strict editorial policy that focuses on accuracy, relevance, and impartiality
Ad discliamer
Morbi pretium leo et nisl aliquam mollis. Quisque arcu lorem, ultricies quis pellentesque nec, ullamcorper eu odio.
Ethereum started a downside correction from the $335 swing high against the US Dollar. ETH price is currently approaching a major support zone near $305 and the 100 hourly SMA.
- Ethereum is losing bullish momentum and it is now trading below $320.
- The price is likely to find a strong buying interest near $305 or the 100 hourly simple moving average.
- There was a break below a key ascending channel with support near $318 on the hourly chart of ETH/USD (data feed via Kraken).
- The pair must stay above the $300 handle to resume its upside in the near term.
Ethereum Price Correcting Gains
There was an upside extension above $330 in Ethereum against the US Dollar. ETH price traded to a new monthly high at $335 and the price settled well above the 100 hourly simple moving average.
The price is currently correcting lower and trading below the $325 level. There was a break below the 50% Fib retracement level of the recent upward move from the $307 swing low to $335 high.
Moreover, there was a break below a key ascending channel with support near $318 on the hourly chart of ETH/USD. The pair is now trading below the $320 level, but there are many supports on the downside. An initial support is near the 76.4% Fib retracement level of the recent upward move from the $307 swing low to $335 high.
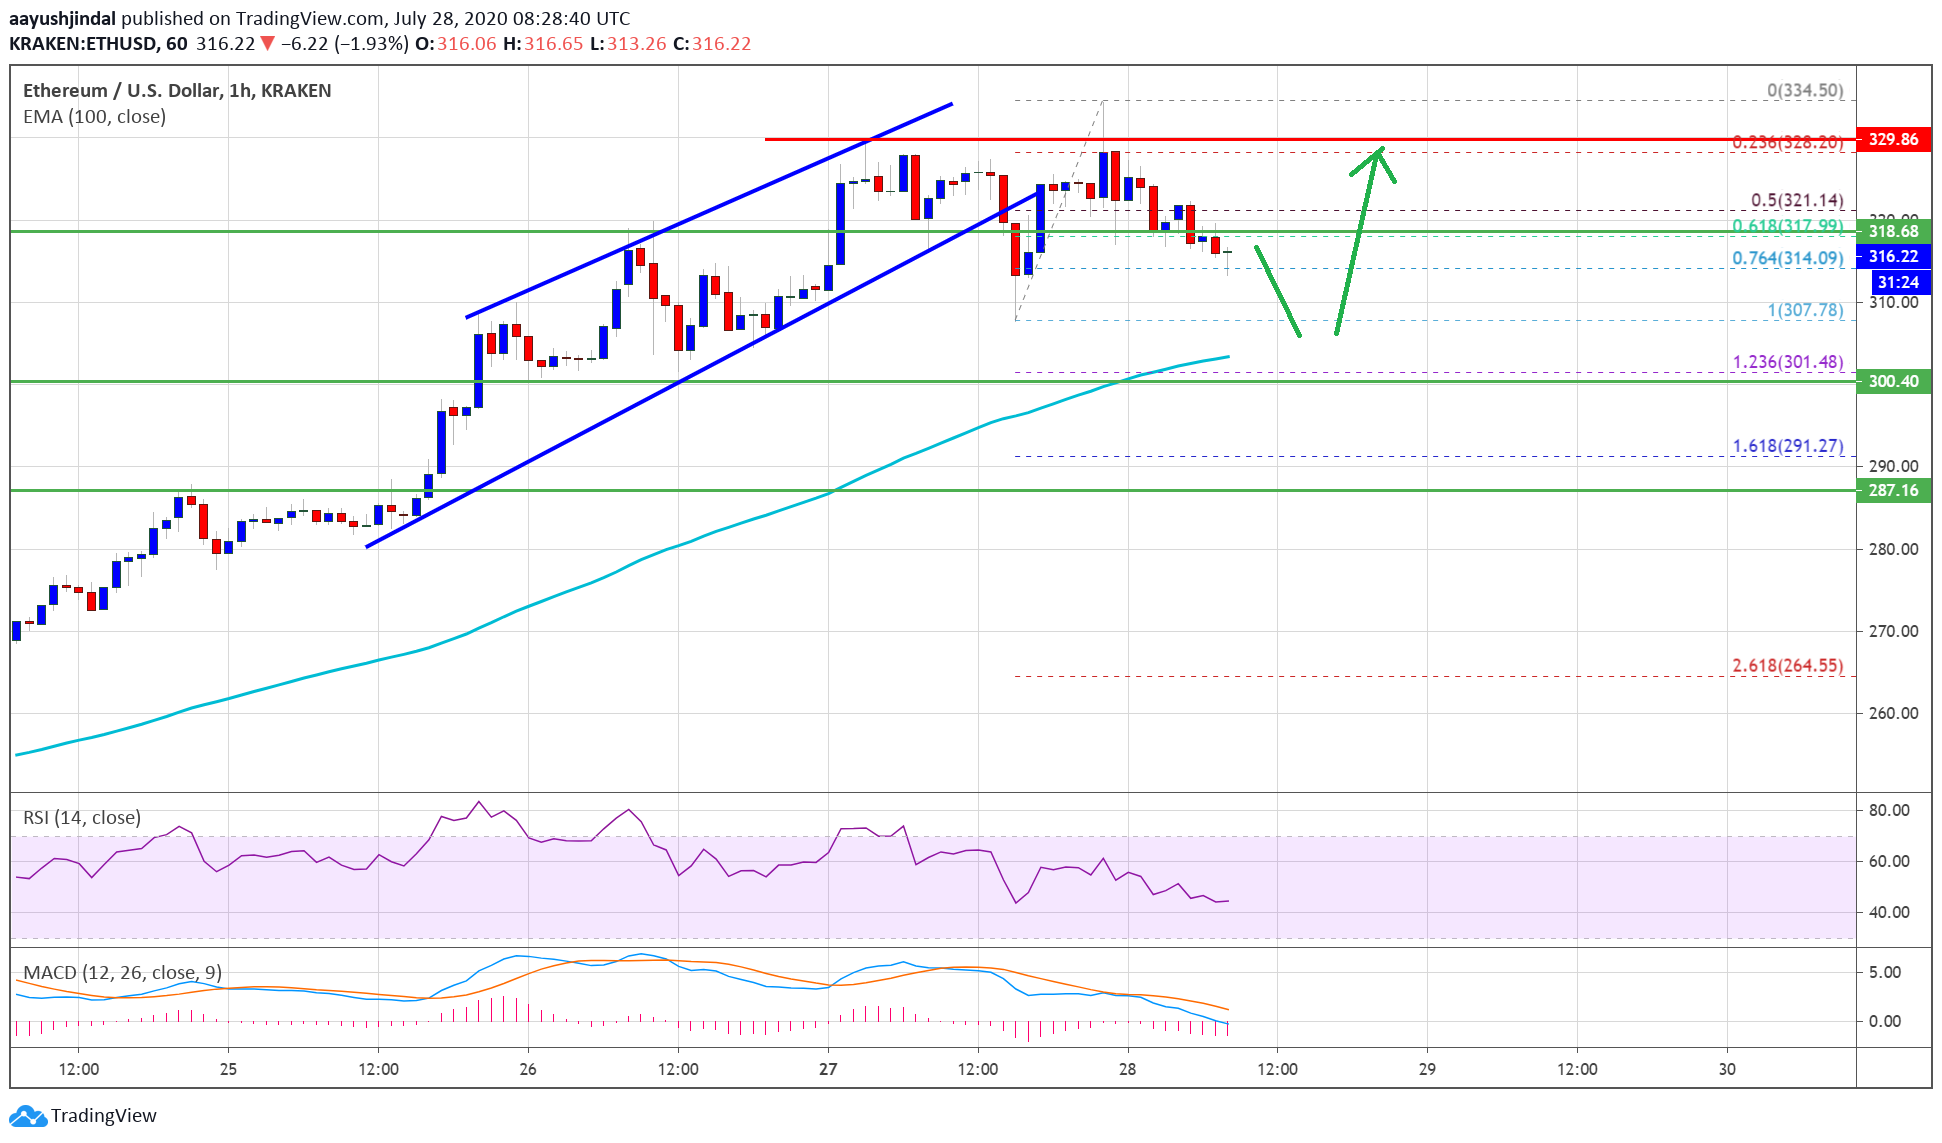
Ethereum price corrects below $320. Source: TradingView.com
The first major support is near the $310 level or the $307 swing low. The main support is seen near the $302 level and the 100 hourly simple moving average.
On the upside, the price could face hurdle near the $322 and $325 levels. A successful break above the $325 resistance could open the doors for a push towards the $335 high or even $345.
Bearish Scenario for ETH
On the downside, ether price is likely to find many supports, starting with $315. The breakdown support is now forming near the $302 and $300 levels, coinciding with the 100 hourly SMA.
If there is a downside break below the $300 level (the pivot zone), the price is likely to decline towards the $285 support zone.
Technical Indicators
Hourly MACD – The MACD for ETH/USD is now gaining pace in the bearish zone.
Hourly RSI – The RSI for ETH/USD is currently sliding below the 50 level.
Major Support Level – $315
Major Resistance Level – $325
Take advantage of the trading opportunities with Plus500
Risk disclaimer: 76.4% of retail CFD accounts lose money.