
Reason to trust
How Our News is Made
Strict editorial policy that focuses on accuracy, relevance, and impartiality
Ad discliamer
Morbi pretium leo et nisl aliquam mollis. Quisque arcu lorem, ultricies quis pellentesque nec, ullamcorper eu odio.
Bitcoin rallied over 10% and it broke the key $10,500 resistance against the US Dollar. BTC is now trading nicely above $11,000 and it seems like the bulls are aiming a test of $12,000.
- Bitcoin extended its rally above the $10,000 and $10,500 resistance levels.
- The price traded to a new monthly high at $11,422 and it is currently consolidating gains.
- There is a major bullish trend line forming with support near $10,8s00 on the hourly chart of the BTC/USD pair (data feed from Kraken).
- The pair is likely to continue higher towards the $11,600 and $12,000 levels in the near term.
Bitcoin Price Gains Pace above $10,500
Yesterday, we saw a strong increase in bitcoin above the $10,000 resistance against the US Dollar. BTC extended its rally above the $10,200 and $10,500 resistance levels to settle above a couple of crucial hurdles.
There was a break above the $11,000 level and the price settled well above the 100 hourly simple moving average. A new monthly high is formed near $11,422 and it is currently consolidating gains. It corrected lower below the $11,200 level.
However, the 50% Fib retracement level of the recent rally from the $10,275 low to $11,422 high acted as a strong support near $10,850. There is also a major bullish trend line forming with support near $10,8s00 on the hourly chart of the BTC/USD pair.
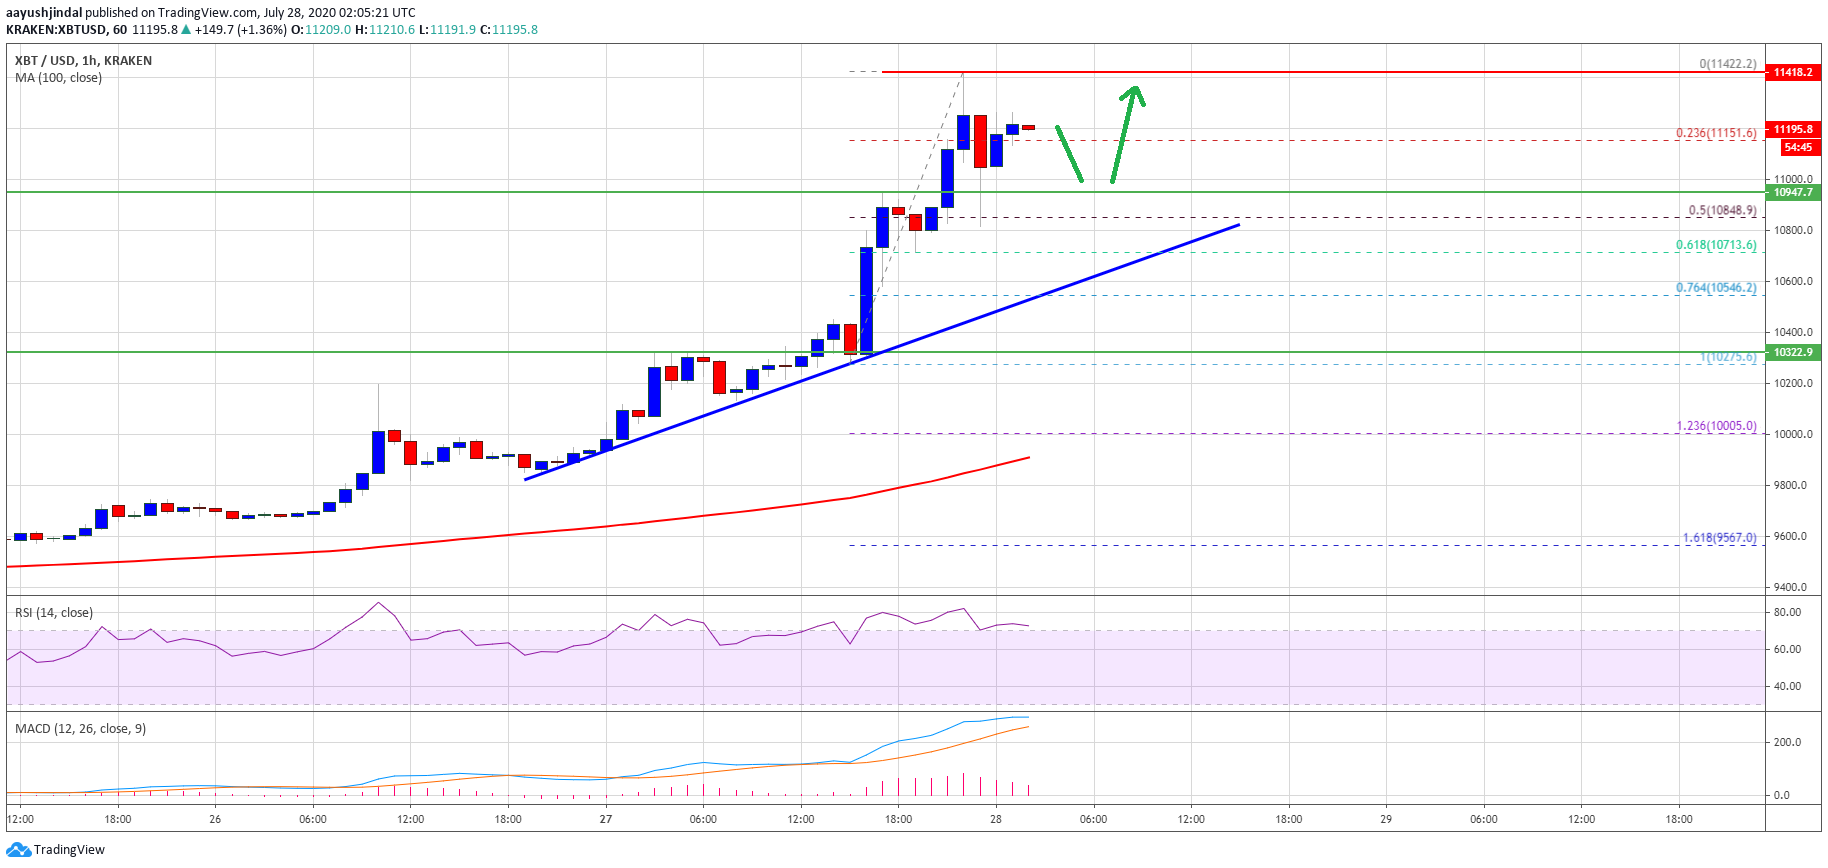
Bitcoin price rallies 12%. Source: TradingView.com
The trend line is close to the 61.8% Fib retracement level of the recent rally from the $10,275 low to $11,422 high. On the upside, the $11,500 level is a major hurdle for the bulls.
A successful break above the $11,400 and $11,500 levels may perhaps open the doors for sharp increase in the near term. The next target for the bulls could be $12,000 in the coming sessions.
Dips Likely Supported in BTC
If there is a downside correction, bitcoin is likely to find bids near the $11,000 and $10,800 levels. The main support is now near the trend line and $10,500.
Any further losses could lead the price towards the $10,300 support zone. The next major support is near the $9,800 level and the 100 hourly simple moving average.
Technical indicators:
Hourly MACD – The MACD is currently losing strength in the bullish zone.
Hourly RSI (Relative Strength Index) – The RSI for BTC/USD is now correcting lower from the 70 level.
Major Support Levels – $11,000, followed by $10,800.
Major Resistance Levels – $11,400, $11,500 and $12,000.