Reason to trust
How Our News is Made
Strict editorial policy that focuses on accuracy, relevance, and impartiality
Ad discliamer
Morbi pretium leo et nisl aliquam mollis. Quisque arcu lorem, ultricies quis pellentesque nec, ullamcorper eu odio.
Ripple traded to a new monthly high at $0.2252 against the US Dollar. XRP price is currently holding the $0.2145 support zone and it could rally above $0.2200.
- Ripple remained in a positive zone above the $0.2000 and $0.2100 levels against the US dollar.
- The price traded to a new monthly high at $0.2252 and settled well above the 100 hourly SMA.
- There is a key contracting triangle forming with resistance near $0.2195 on the hourly chart of the XRP/USD pair (data source from Kraken).
- The pair is likely to start a fresh rally above $0.2200 as long as it is above $0.2100.
Ripple Price Could Rise Again
There was a sharp increase in ripple after it broke the $0.2020 resistance area. XRP price even traded above the $0.2120 resistance and settled well above the 100 hourly simple moving average.
It traded to a new monthly high at $0.2252 and recently started a downside correction. There was a break below the $0.2200 and $0.2160 support levels. The price tested the $0.2145 and $0.2135 support levels.
A swing low is formed near $0.2135 and the price is currently trading nicely in a positive zone. It already tested the 50% Fib retracement level of the recent decline from the $0.2252 swing high to $0.2135 swing low.
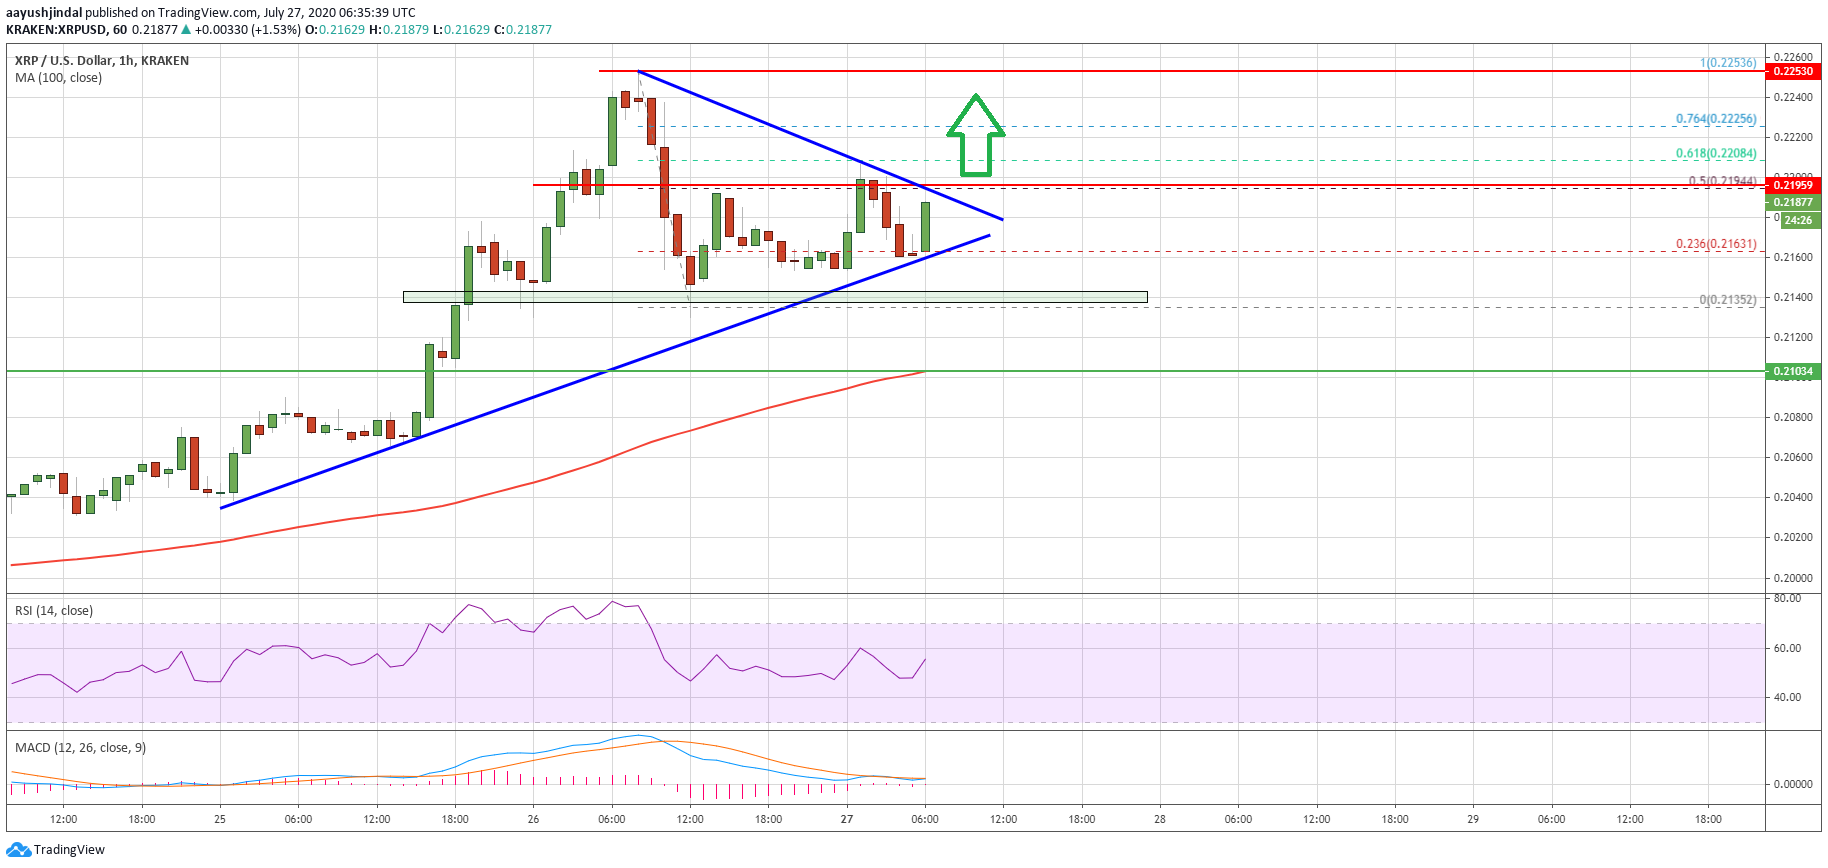
Ripple price above $0.2150. Source: TradingView.com
However, the price is facing hurdles near the $0.2195 and $0.2200 levels. There is also a key contracting triangle forming with resistance near $0.2195 on the hourly chart of the XRP/USD pair. Above the triangle resistance, the next resistance could be $0.2210.
The 61.8% Fib retracement level of the recent decline from the $0.2252 swing high to $0.2135 swing low might also prevent upsides near $0.2208. If the bulls gain strength above $0.2200 and $0.2210 resistance levels, the price is likely to retest $0.2250. Any further gains could lead the price above the $0.2300 level in the near term.
Dips Likely Supported in XRP
On the downside, the triangle support is near the $0.2168 level. If there is a downside break below the triangle support, ripple could revisit the $0.2135 support level.
The next major support is near the $0.2100 level (the last breakout zone), below which the price might continue to move down towards the $0.2020 support.
Technical Indicators
Hourly MACD – The MACD for XRP/USD is slowly moving in the bullish zone.
Hourly RSI (Relative Strength Index) – The RSI for XRP/USD is just above the 50 level.
Major Support Levels – $0.2165, $0.2135 and $0.2100.
Major Resistance Levels – $0.2200, $0.2210 and $0.2250.
Take advantage of the trading opportunities with Plus500
Risk disclaimer: 76.4% of retail CFD accounts lose money.