
Reason to trust
How Our News is Made
Strict editorial policy that focuses on accuracy, relevance, and impartiality
Ad discliamer
Morbi pretium leo et nisl aliquam mollis. Quisque arcu lorem, ultricies quis pellentesque nec, ullamcorper eu odio.
Ripple is up over 2% and it broke the main $0.2000 resistance zone against the US Dollar. XRP price is trading in a positive zone and it could continue to rise towards $0.2120 or $0.2150.
- Ripple price broke a couple of important hurdles near the $0.2000 level against the US dollar.
- The price spiked towards $0.2050 and it is currently correcting gains.
- There was a break above this week’s followed bullish flag with resistance near $0.1990 on the 4-hours chart of the XRP/USD pair (data source from Kraken).
- The pair could correct in the short-term, but it is likely to resume its upward move towards $0.2120.
Ripple Price Breaks Key Resistance
In the past few analysis, we followed a bullish flag pattern for ripple’s XRP, with hurdles near $0.2000. The price did remain in a positive zone above the $0.1920 support level and the 100 simple moving average (4-hours).
As a result, the price broke to the upside and cleared a heavy resistance near $0.2000. There was also a break above this week’s followed bullish flag with resistance near $0.1990 on the 4-hours chart of the XRP/USD pair.
The pair spiked towards the $0.2050 level and traded to a new weekly high at $0.2055. The price is currently correcting lower and trading below $0.2040. An initial support is near the $0.2025 level, plus the 23.6% Fib retracement level of the recent upward move from the $0.1916 low to $0.2055 high.
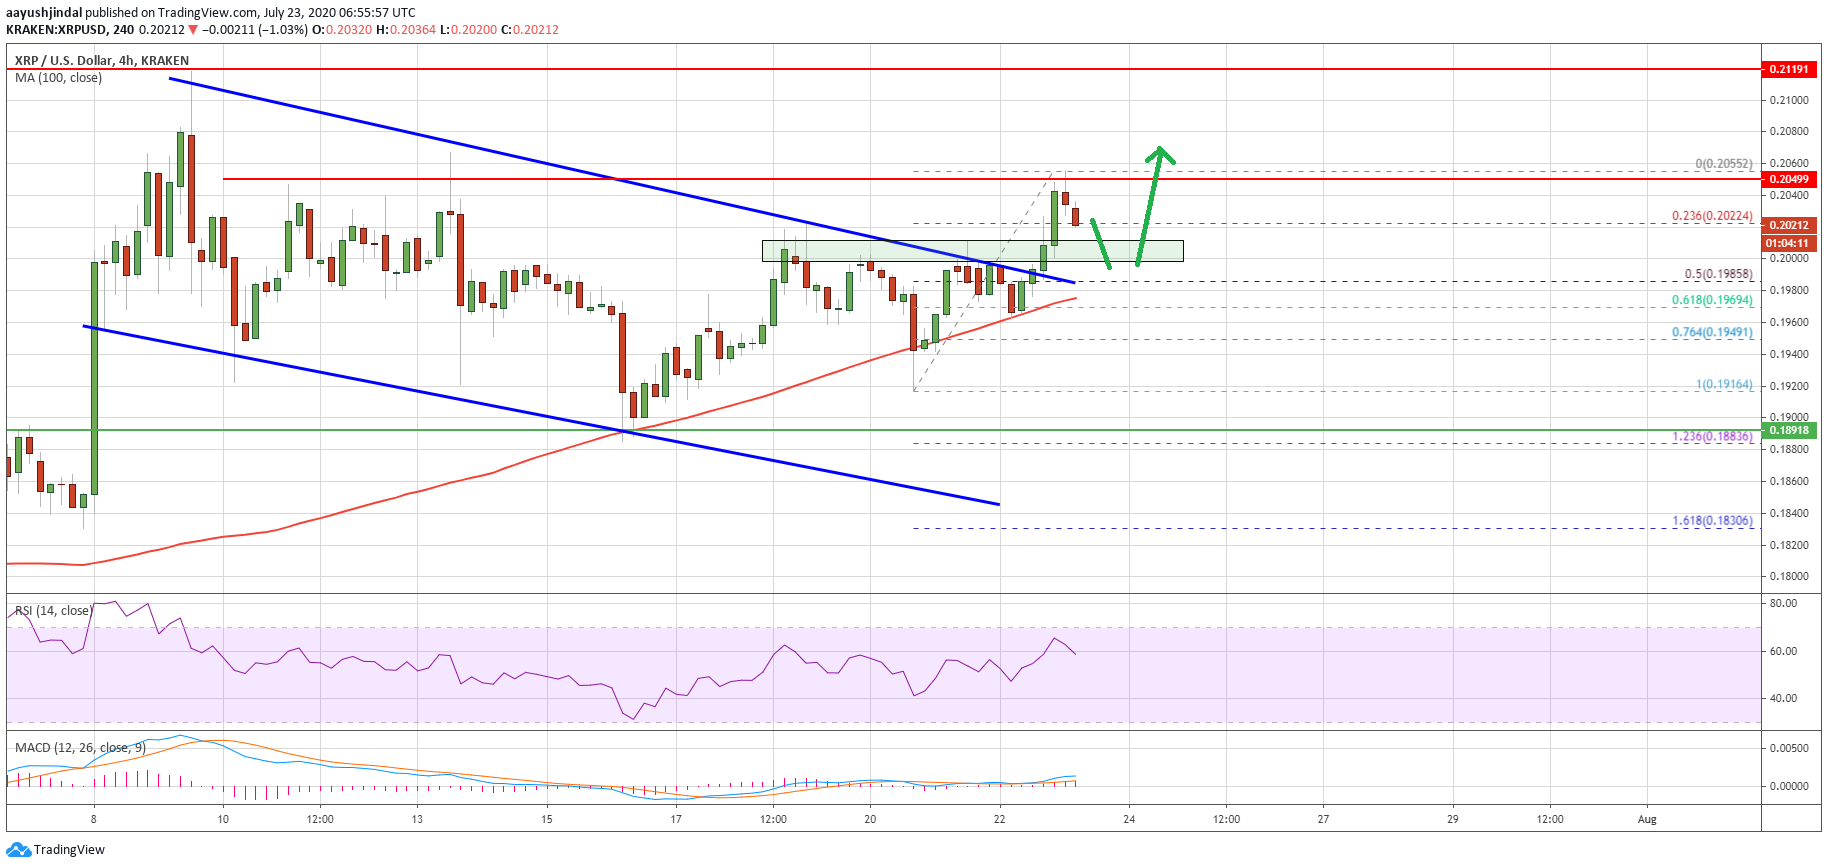
Ripple (XRP) price settles above $0.2000. Source: TradingView.com
On the downside, the main support is near the $0.2000 level and the recent breakout zone. The 50% Fib retracement level of the recent upward move from the $0.1916 low to $0.2055 high is also near the $0.1985 level.
The price is clearly showing a lot of positive signs and it might continue to rise above the $0.2050 level. The next major resistance is near the $0.2120 level, above which the bulls are likely to aim a test of $0.2150.
Downsides Likely To Be Limited in XRP
In the short-term, there could be a downside correction in ripple below $0.2020. However, the bulls are likely to defend the $0.2000 and $0.1985 support levels.
If there is a bearish break below the $0.1985 support, there is a risk of a trend line. The last line of defense could be 100 simple moving average (4-hours) and $0.1965, below which the price might revisit $0.1900.
Technical Indicators
4-Hours MACD – The MACD for XRP/USD is slowly gaining strength in the bullish zone.
4-Hours RSI (Relative Strength Index) – The RSI for XRP/USD is currently well above the 55 level.
Major Support Levels – $0.2020, $0.2000 and $0.1985.
Major Resistance Levels – $0.2050, $0.2120 and $0.2150.
Take advantage of the trading opportunities with Plus500
Risk disclaimer: 76.4% of retail CFD accounts lose money.