
Reason to trust
How Our News is Made
Strict editorial policy that focuses on accuracy, relevance, and impartiality
Ad discliamer
Morbi pretium leo et nisl aliquam mollis. Quisque arcu lorem, ultricies quis pellentesque nec, ullamcorper eu odio.
Ethereum gained bullish momentum above the $240 resistance against the US Dollar. ETH price is currently correcting gains, but it is likely to resume its upside above $245.
- Ethereum settled above the $235 resistance and it climbed above the $242 resistance.
- The price traded as high as $247 and it is currently correcting lower.
- There was a break below a short-term bullish trend line with support near $245 on the hourly chart of ETH/USD (data feed via Kraken).
- The pair could continue to rise as long as it is above the $242 and $240 support levels.
Ethereum Price Turns Green
Yesterday, Ethereum saw a strong rise in buying interest above $235 against the US Dollar. ETH price settled above the $235 resistance and it climbed above the $242 resistance.
The price traded as high as $247 and settled above the 100 hourly simple moving average. Recently, it started a downside correction below the $245 level. There was also a break below a short-term bullish trend line with support near $245 on the hourly chart of ETH/USD.
The pair is now testing the 23.6% Fib retracement level of the upward move from the $234 swing low $247 high. An immediate support is near the $242 level (the recent breakout zone).
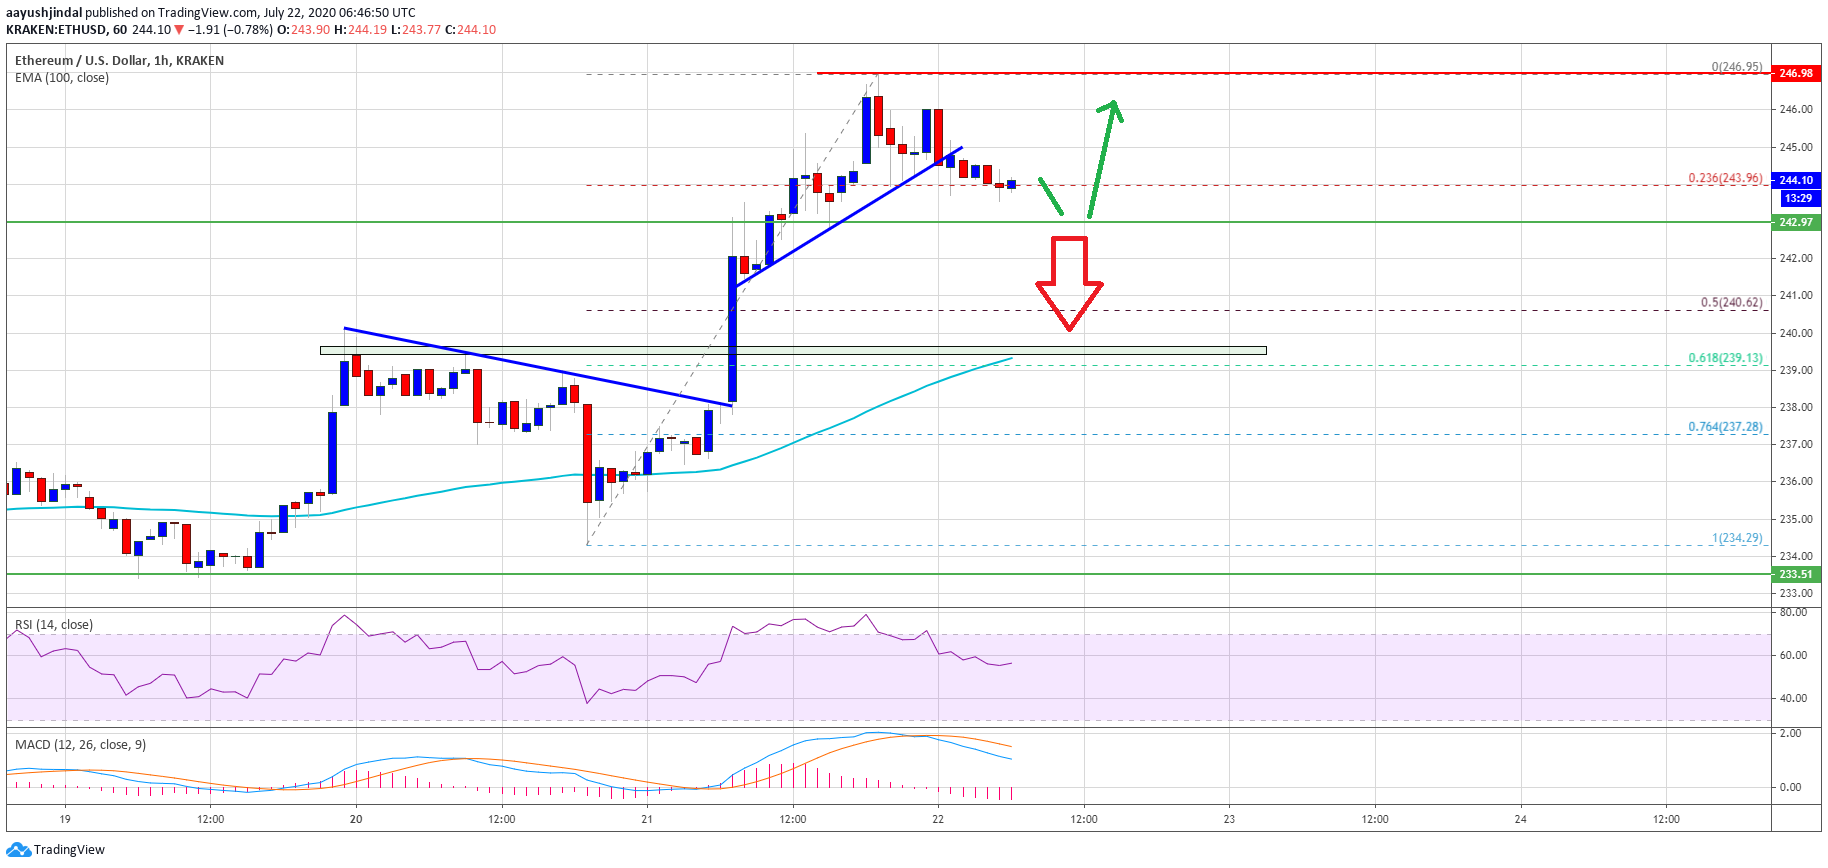
Ethereum price trades above $242. Source: TradingView.com
If ether price breaks the $242 support, it could extend its correction towards the $240 support. The 50% Fib retracement level of the upward move from the $234 swing low $247 high is also near the $240 support zone along with the 100 hourly simple moving average.
On the upside, the price is facing a couple of short-term hurdles near $245 and $248. The main hurdle is near the $250 level, above which ether is likely to accelerate higher towards the $258 and $262 levels.
Bearish Move in ETH?
On the downside, there is a crucial support forming near the $240 level and the 100 hourly simple moving average. A close below the $240 support might push the price back into a bearish zone.
The next major support is near the weekly pivot level at $235, below which the price is likely to accelerate lower towards the $230 level.
Technical Indicators
Hourly MACD – The MACD for ETH/USD is slowly gaining pace in the bearish zone.
Hourly RSI – The RSI for ETH/USD is currently correcting lower towards the 50 level.
Major Support Level – $240
Major Resistance Level – $248
Take advantage of the trading opportunities with Plus500
Risk disclaimer: 76.4% of retail CFD accounts lose money.