Reason to trust
How Our News is Made
Strict editorial policy that focuses on accuracy, relevance, and impartiality
Ad discliamer
Morbi pretium leo et nisl aliquam mollis. Quisque arcu lorem, ultricies quis pellentesque nec, ullamcorper eu odio.
Bitcoin gained more than 2.5% and broke the main $9,300 resistance against the US Dollar. BTC is currently consolidating gains and it is likely setting up for more upsides towards $9,550.
- Bitcoin gained bullish momentum above the $9,200 and $9,300 resistance levels.
- The price is currently consolidating above $9,300 and it is well above the 100 hourly simple moving average.
- There is a short-term contracting triangle forming with resistance near $9,385 on the hourly chart of the BTC/USD pair (data feed from Kraken).
- The pair is likely to continue higher if it clears the $9,385 and $9,400 resistance levels.
Bitcoin Price Signaling More Gains
Yesterday, we discussed the chances of bitcoin ending its deadlock of $9,000 against the US Dollar. BTC did break the range and started a strong increase above the $9,200 resistance level.
The bulls were able to clear the $9,300 resistance and the price settled well above the 100 hourly simple moving average. It even surpassed the $9,400 level and traded to a new weekly high at $9,437.
Bitcoin is currently consolidating gains below the $9,400 level. It traded below the 23.6% Fib retracement level of the recent rally from the $9,150 swing low to $9,437 high. There is a short-term contracting triangle forming with resistance near $9,385 on the hourly chart of the BTC/USD pair.
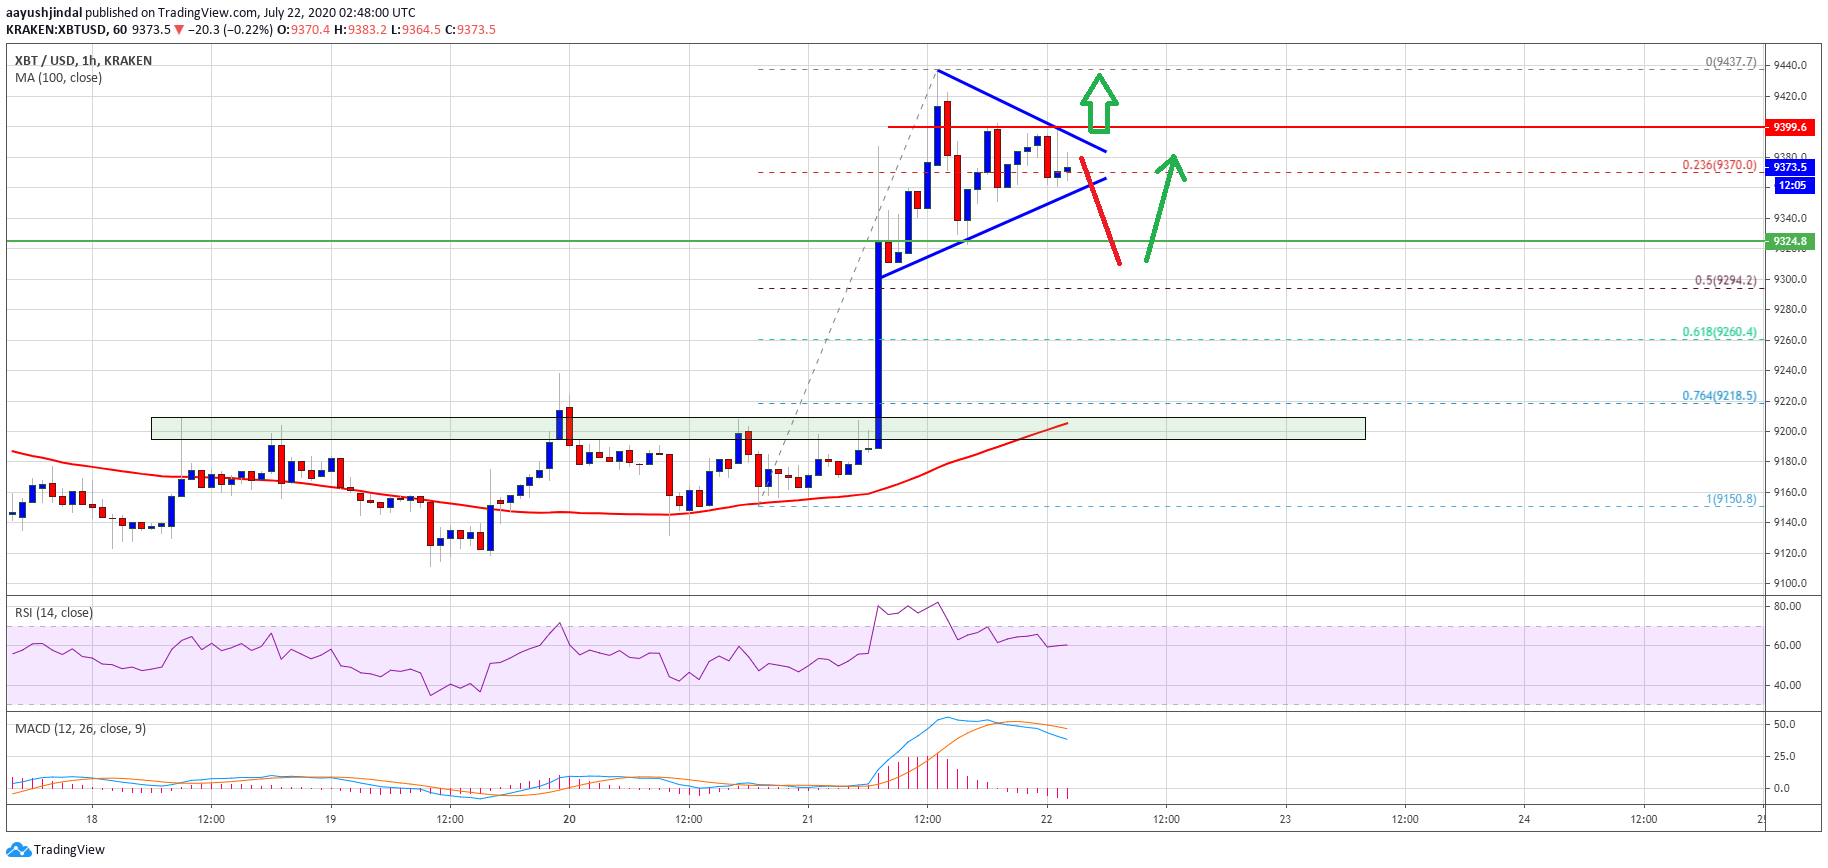
Bitcoin price breaks $9,400: Source: TradingView.com
If the pair breaks the triangle resistance and $9,400, it is likely to continue higher. A successful close above the $9,400 level will most likely open the doors for a push towards the $9,500 and $9,550 resistance levels in the coming sessions.
Any further gains could lead the price towards the $9,800 level. An intermediate resistance may perhaps be near the $9,650 level.
Dips Likely Supported in BTC
If bitcoin breaks the triangle support, it could correct below the $9,350 level. The next support is near the $9,300 level (a multi-touch zone). The 50% Fib retracement level of the recent rally from the $9,150 swing low to $9,437 high is also close to the $9,300 level.
Any further losses below $9,300 could push the price towards the main $9,200 support and the 100 hourly simple moving average. A close below the 100 hourly SMA might lead the price towards the $9,000 support.
Technical indicators:
Hourly MACD – The MACD is currently moving slowly in the bearish zone.
Hourly RSI (Relative Strength Index) – The RSI for BTC/USD is well above the 50 level.
Major Support Levels – $9,350, followed by $9,300.
Major Resistance Levels – $9,380, $9,400 and $9,550.