
Reason to trust
How Our News is Made
Strict editorial policy that focuses on accuracy, relevance, and impartiality
Ad discliamer
Morbi pretium leo et nisl aliquam mollis. Quisque arcu lorem, ultricies quis pellentesque nec, ullamcorper eu odio.
Ethereum’s Ether is recovering and trading above the $235 resistance against the US Dollar. ETH seems to be preparing for a crucial upside break above $238 and $240.
- Ether is recovering from the $232 support and trading above $235.
- The price is now approaching the main $238 and $240 resistance levels.
- There is a major bearish trend line forming with resistance near $238 on the hourly chart of ETH/USD (data feed via Kraken).
- The pair could start a strong increase if it clears the $238 and $240 resistance levels.
Ether Price Approaching Next Break
After another rejection near $240, Ether price corrected lower against the US Dollar. ETH traded below the $236 support level, but it remained well bid above the $232 level.
A low was formed near $234 and the price recently corrected higher. It broke the $235 and $236 resistance levels. There was a break above the 50% Fib retracement level of the recent drop from the $240 swing high to $234 low.
The price is now trading above the $237 level and the 100 hourly simple moving average. However, it is now facing hurdles near the $238 level. There is also a major bearish trend line forming with resistance near $238 on the hourly chart of ETH/USD.
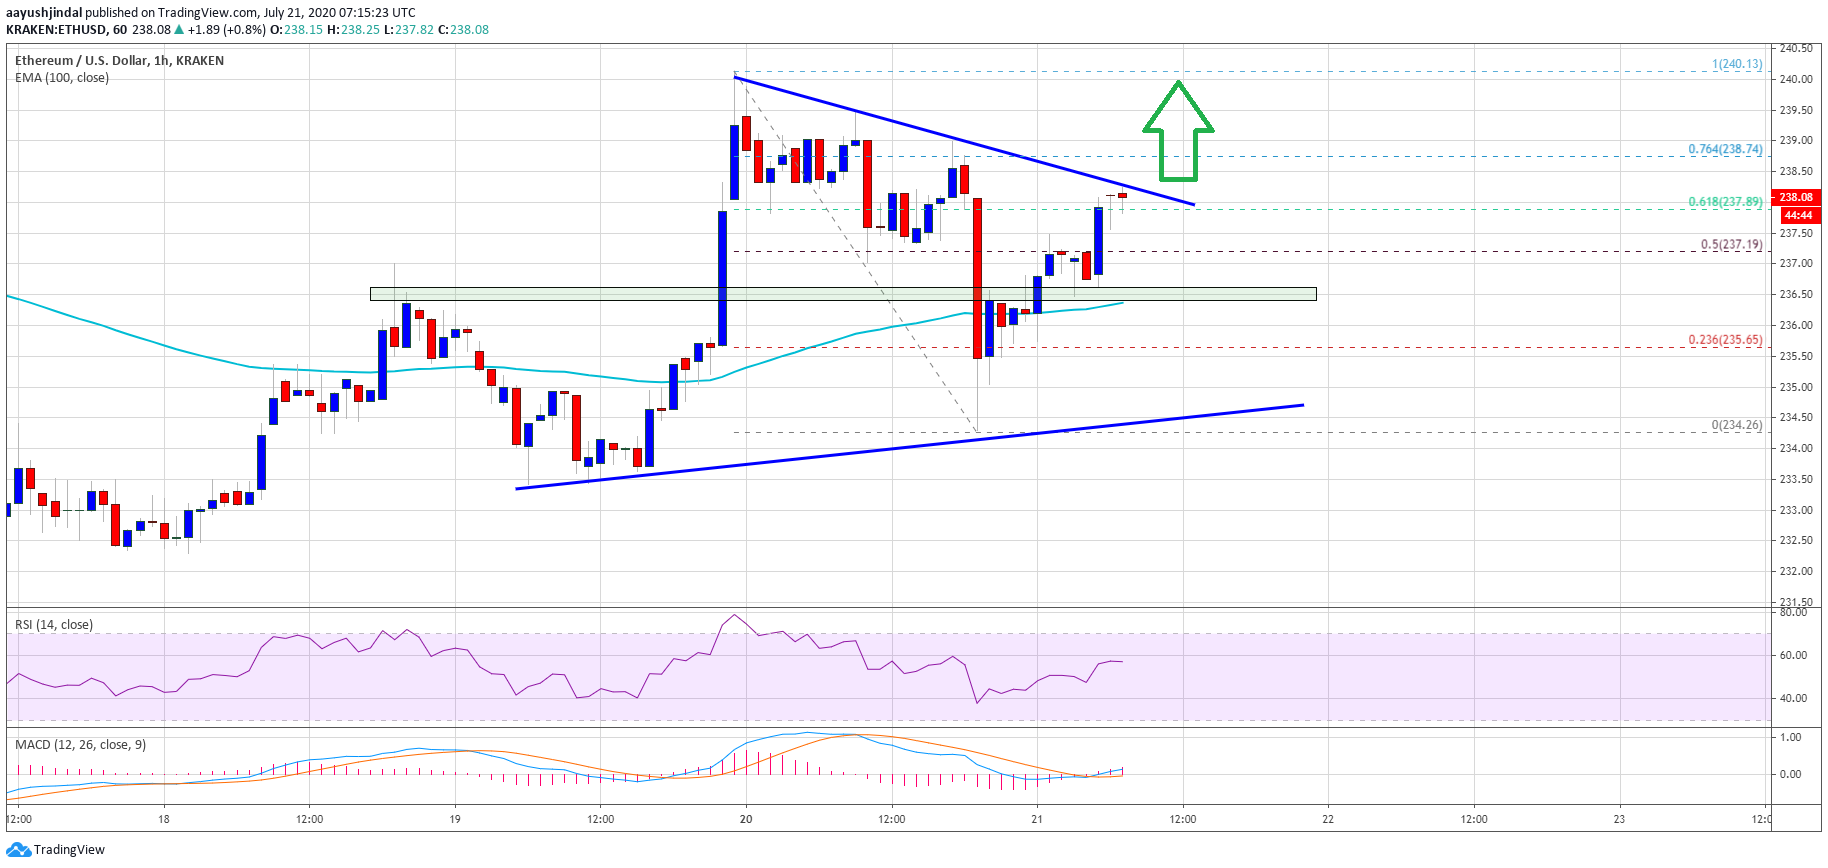
Ethereum's Ether testing $238. Source: TradingView.com
The 76.4% Fib retracement level of the recent drop from the $240 swing high to $234 low is also close to the $238 level. If the bulls gain strength above the trend line and $238, there are chances of a steady rise towards $240 and $242. Any further gains could open the doors for a strong rally towards the $250 and $252 levels.
Fresh Decline in ETH?
On the downside, there is a major support forming near the $236 level and the 100 hourly simple moving average. The next major support is near the $234 level and a connecting bullish trend line.
If Ether fails to stay above the $234-$235 support zone, there is a risk of a sharp decline. The next major support is near the weekly pivot level at $230, followed by $228.
Technical Indicators
Hourly MACD – The MACD for ETH/USD is now gaining strength in the bullish zone.
Hourly RSI – The RSI for ETH/USD is currently rising and it is well above the 50 level.
Major Support Level – $235
Major Resistance Level – $240
Take advantage of the trading opportunities with Plus500
Risk disclaimer: 76.4% of retail CFD accounts lose money.


