Reason to trust
How Our News is Made
Strict editorial policy that focuses on accuracy, relevance, and impartiality
Ad discliamer
Morbi pretium leo et nisl aliquam mollis. Quisque arcu lorem, ultricies quis pellentesque nec, ullamcorper eu odio.
Bitcoin is trading in a contracting range above $9,000 against the US Dollar. BTC’s daily chart suggests that the price could rally above $9,300 as long as it is above the 100-day SMA.
- Bitcoin is holding a couple of important supports near $9,000 and $8,800.
- The price is currently facing strong barriers near $9,300 and $9,400.
- There is a crucial contracting triangle forming with resistance near $9,250 on the daily chart of the BTC/USD pair (data feed from Kraken).
- The pair could start a sharp rally above $9,300 as long as it is above the 100-day simple moving average.
Bitcoin Price Could Restart its Rally
In the past few days, bitcoin price mostly traded with a bearish angle below the $9,500 resistance against the US Dollar. BTC even settled below the $9,300 level, but it remained well above the 100-day simple moving average.
The last swing low was formed near $8,809 before the price started a short-term upside correction. There was a break above the $9,000 and $9,200 levels. The price even broke the 50% Fib retracement level of the downward move from the $9,768 swing high to $8,809 low.
However, the upward move was capped by the $9,400 resistance level. The bulls also struggled to clear the 61.8% Fib retracement level of the downward move from the $9,768 swing high to $8,809 low.
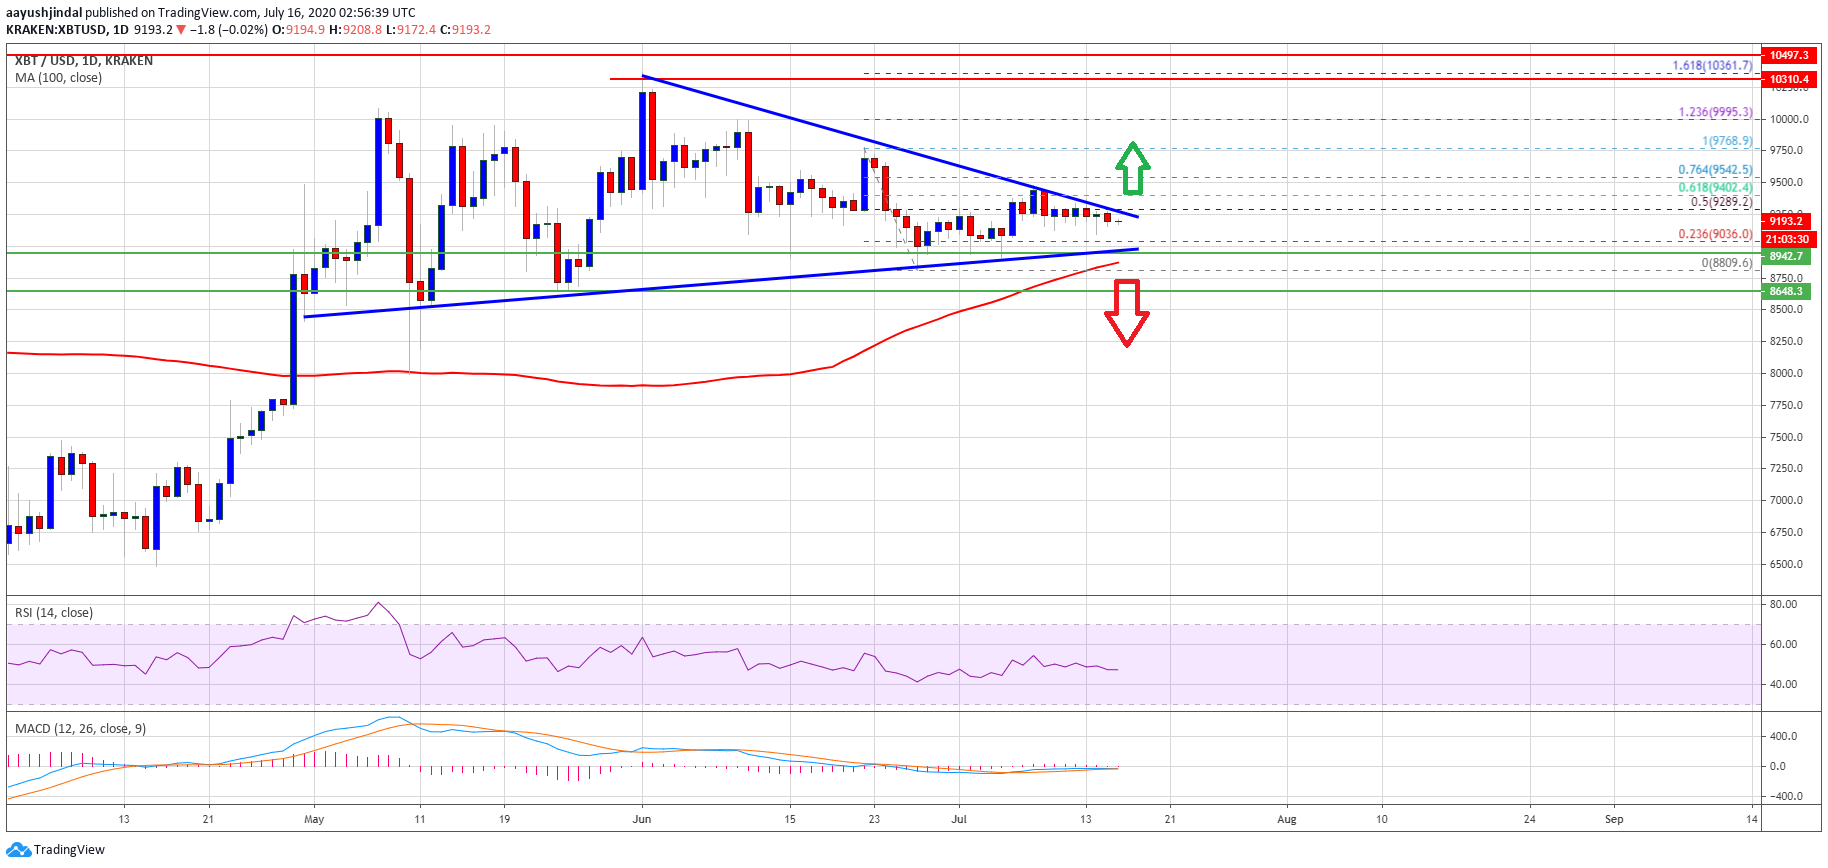
Bitcoin price holding $9,000: Source: TradingView.com
It seems like there is a crucial contracting triangle forming with resistance near $9,250 on the daily chart of the BTC/USD pair. If there is a clear break above the triangle resistance and $9,300, the price could start a sharp upward move.
The next hurdles are $9,400 and $9,500, above which the bulls are likely to aim a retest of the main $10,000 handle in the coming days.
Chances of Downside Break?
On the downside, there is a significant support forming near $9,000, $8,800 and the 100-day simple moving average. As long as the price is above the 100-day SMA, there are chances of an upside break above $9,300.
If not, there is a risk of a nasty decline below the $8,800 support. In the mentioned case, the price may perhaps nosedive towards the $8,200 and $8,000 levels in the near future.
Technical indicators:
Daily MACD – The MACD is about to move into the bullish zone.
Daily RSI (Relative Strength Index) – The RSI for BTC/USD is now just below the 50 level.
Major Support Levels – $9,000 followed by $8,800.
Major Resistance Levels – $9,250, $9,300 and $9,500.