
Reason to trust
How Our News is Made
Strict editorial policy that focuses on accuracy, relevance, and impartiality
Ad discliamer
Morbi pretium leo et nisl aliquam mollis. Quisque arcu lorem, ultricies quis pellentesque nec, ullamcorper eu odio.
Bitcoin extended its decline and spiked towards $9,100 against the US Dollar. BTC is currently recovering, but it must gain strength above $9,300 for a sustained upward move.
- Bitcoin spiked to the downside and traded to a new weekly low at $9,096.
- The price is currently trading above $9,200, but it is still facing a strong hurdle near $9,330.
- There is a key bearish trend line forming with resistance near $9,280 on the hourly chart of the BTC/USD pair (data feed from Kraken).
- The pair must gain strength above the $9,330 resistance for a sustained upward move.
Bitcoin Price is Trading Near Key Juncture
After another rejection near the $9,300 resistance, bitcoin started a fresh decline against the US Dollar. BTC broke the $9,200 support level and the 100 hourly simple moving average.
It spiked below the $9,120 support level, but downsides were limited below $9,100. A new weekly low is formed near $9,096 and the price recovered sharply above $9,100. It surpassed the $9,200 level and the 100 hourly simple moving average.
There was a break above the 50% Fib retracement level of the recent drop from the $9,333 high to $9,096 low. However, the price is still struggling to clear the $9,300 resistance zone.
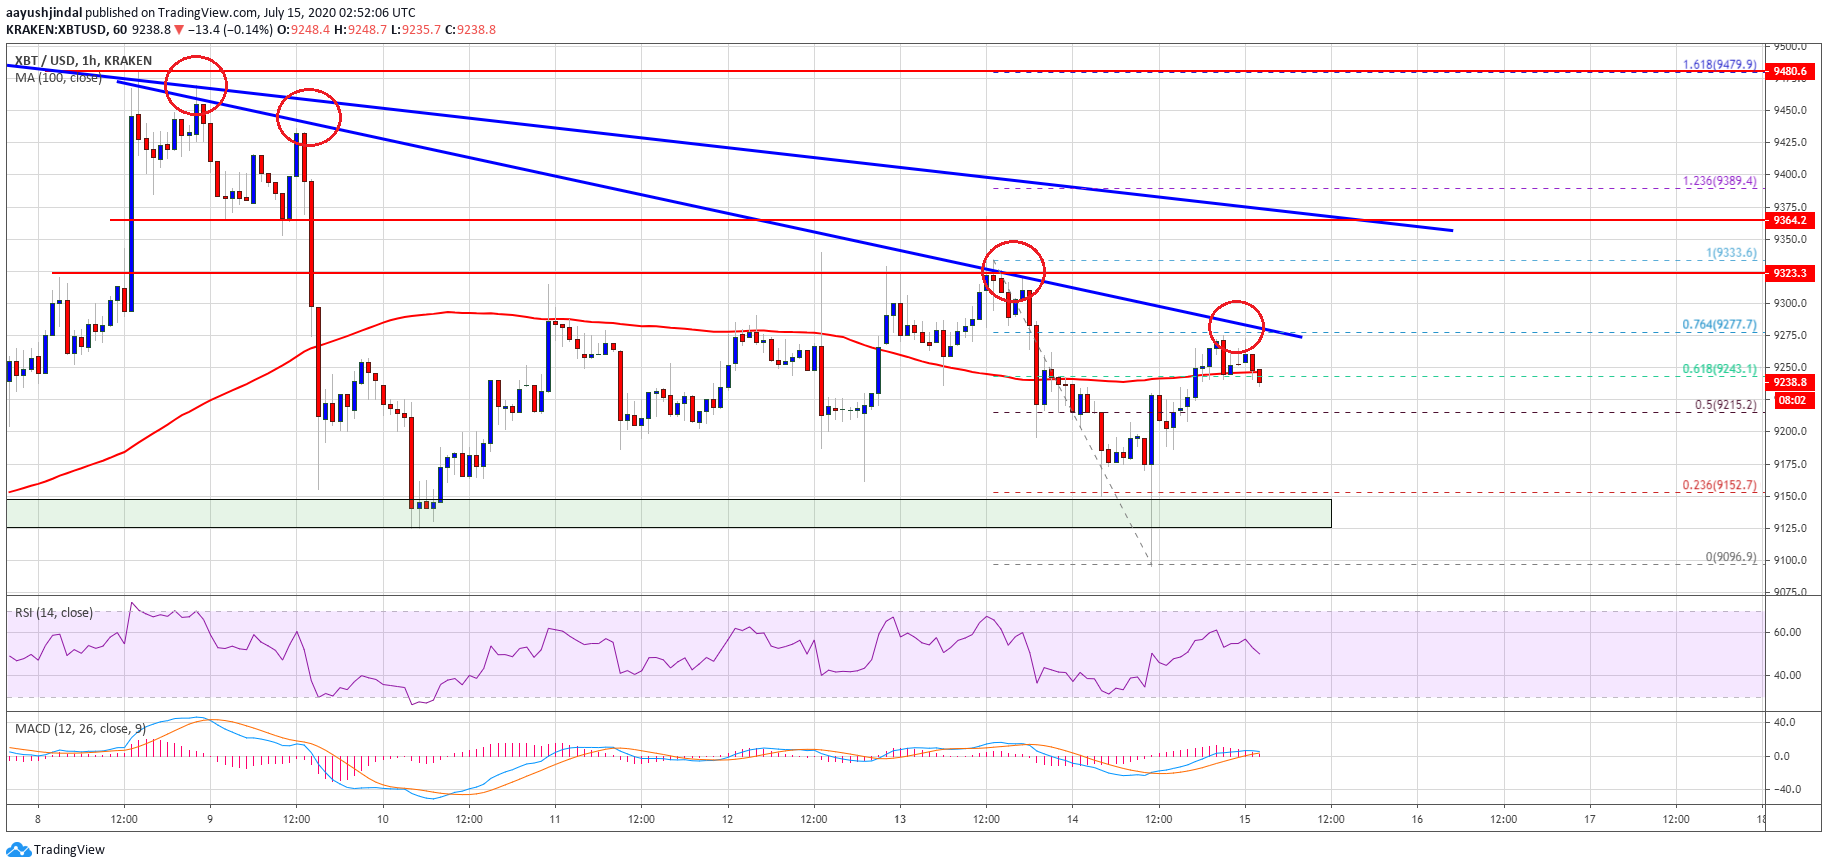
Bitcoin price testing $9,250: Source: TradingView.com
There is also a key bearish trend line forming with resistance near $9,280 on the hourly chart of the BTC/USD pair. The trend line is close to the 76.4% Fib retracement level of the recent drop from the $9,333 high to $9,096 low.
The pair must gain bullish momentum above the trend line, $9,300 and $9,330 to start a sustained upward move. If the bulls succeed, the price is likely to surge towards the $9,500 and $9,550 levels in the near term.
Downside Break in BTC
If bitcoin price fails to continue higher above the trend line resistance or $9,300, it is likely to start another decline in the next 2-3 sessions. An immediate support is near the $9,200 level.
The main support is still near the $9,120 zone. If there is a proper close below the $9,120 support, the bears are likely to aim a larger decline below the $9,000 support in the near term. The next support could be $8,800 or $8,650.
Technical indicators:
Hourly MACD – The MACD is slowly moving into the bearish zone.
Hourly RSI (Relative Strength Index) – The RSI for BTC/USD is struggling to stay above the 50 level.
Major Support Levels – $9,200, followed by $9,120.
Major Resistance Levels – $9,280, $9,300 and $9,330.


